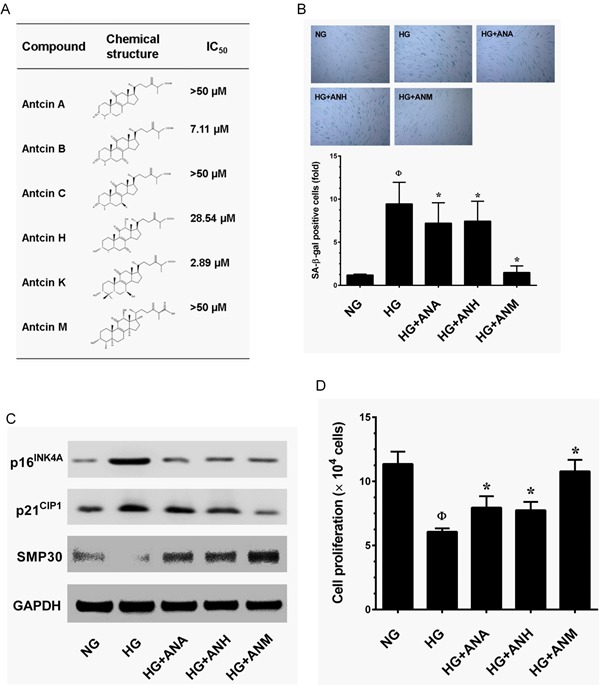
Figure 2. Effects of antcins on HG-induced senescence in HNDFs.

A. Type of antcins subjected to screen for potential anti-aging agents for skin aging. Names and chemical structures of the antcins are shown in the left and centrer column, respectively. The cytotoxic effects of antcins against HNDFs. Briefly, HNDFs were incubated with increasing concentrations (1, 5, 10 and 20 μM) of antcins including antcin A, antcin B, antcin C, antcin H, anticn K and antcin M for 72 h and the cell viability was determined by MTT assay. The 50% inhibitory concentrations (IC50) of each compound against HNDFs are shown in right column. B. Cells were incubated with antcin A (10 μM), antcin H (10 μM) and antcin M (10 μM) in the presence of HG (30 mM) for 72 h. Cellular senescence was determined by SA-β-gal activity. The left panel shows representative figures and the right panel shows quantitative analysis of SA-β-gal positive cells per microscopic field. C. HNDFs were incubated with antcin A (10 μM), antcin H (10 μM) and antcin M (10 μM) in the presence of HG (30 mM) for 72 h. Senescence-associated marker proteins such as p16INK4A, p21CIP1 and SMP30 were determined by western blot analysis. D. To determine the effect of antcins on cell proliferation efficacy, HNDFs 5 × 10⁴ cells/well in 6-well plates were incubated with antcins in the presence of HG (30 mM) for 72 h. Number of viable cells were quantified by the tryphan blue exclusion method. Results are expressed as mean ± S.E.M of three indipendent expriments. Statistical significance was et at ФP < 0.05 compared to NG vs HG and *P < 0.05 compared to HG vs. samples.
