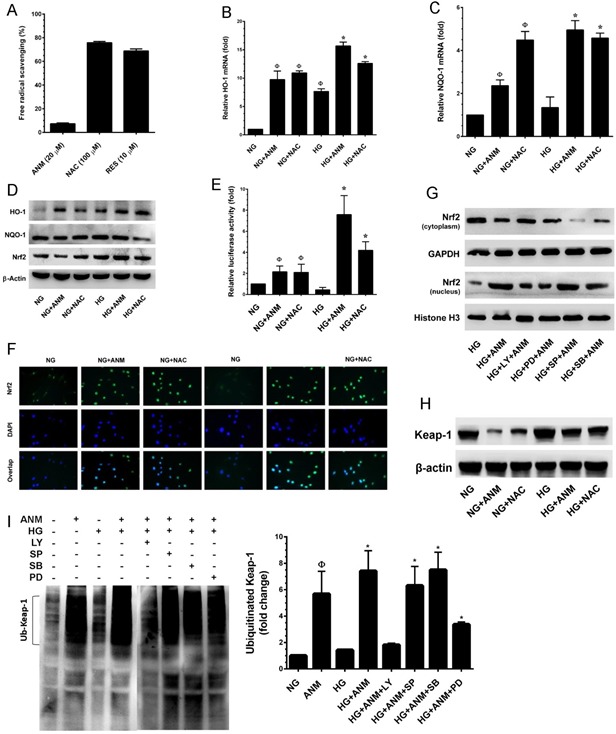
Figure 5. Antcin M activates Nrf2-dependent anti-oxidant defense in HNDFs.

A. To determine the free-radical scavenging effect of ANM, cell-free DPPH assay was performed. NAC and RES were used as positive controls. B., C. To quantify the mRNA expression levels of HO-1 and NQO-1, HNDFs were incubated with ANM (10 μM) or NAC (100 μM) in the presence or absence of HG (30 mM) for 12 h. Total RNA was extracted and subjected to Q-PCR analysis. Relative mRNA levels were normalized with β-actin mRNA. D. To determine the protein expression levels of HO-1, NQO-1 and Nrf2, HNDFs were incubated with ANM (10 μM) or NAC (100 μM) for 24 h. Total cell lysates were prepared and subjected to western blot analysis to monitor the expression levels of HO-1, NQO-1 and Nrf2. E. To determine the Nrf2 transcriptional activity, HNDFs were transiently transfected with ARE promoter construct using lipofectamine and incubated with ANM (10 μM) or NAC (100 μM) in the presence or absence of HG (30 mM) for 6 h. Cell lysates were mixed with luciferase reagents and quantified using an illuminometer. Relative ARE promoter activity was calculated by dividing the relative luciferace unit (RLU) of treated cells by RLU of untreated cells (NG). F. To determine the nuclear localization of Nrf2, HNDFs were incubated with ANM (10 μM) or NAC (100 μM) in the presence or absence or HG (30 mM) for 2 h. The protein expression and localization of Nrf2 was measured by immunofluorescence using Nrf2 specific primary antibody and fluorescein isothiocyanate-conjugated secondary antibody (green). The subcellular and nuclear localization of Nrf2 was photographed using a fluoroscence microscope. DAPI (1 μM) was used to stain the nucleus. G. HNDFs were pre-incubated with AKT, ERK1/2, JNK/SAPK and p38 MAPK inhbitors LY294002 (LY, 30 μM), PD98059 (PD, 30 μM), SP600125 (SP, 30 μM) and SB203580 (SB, 30 μM), respectively for 2 h and then incubated with ANM (10 μM) in the presence of HG (30 mM) 2 h. Cytoplasmic and nuclear fractions were prepared and subjected to western blot analysis. GAPDH and histone H3 served as internal controls for the cytoplasmic and nuclear fraction, respectively. H. The Keap-1 protein expression level was determined by western blotting. I. Effect of ANM on ubiquitination of Keap-1. Equivalent amount of proteins were immune-precipitated with Keap-1 antibody and visualized by western blotting with ubiquitin antibody. Histogram shows the percentage of ubiquinated Keap-1. Results expressed as mean ± S.E.M of three indipendent expriments. Statistical significance was set at ФP < 0.05 compared to NG vs. HG or ANM alone or NAC alone and *P < 0.05 compared to HG vs. samples.
