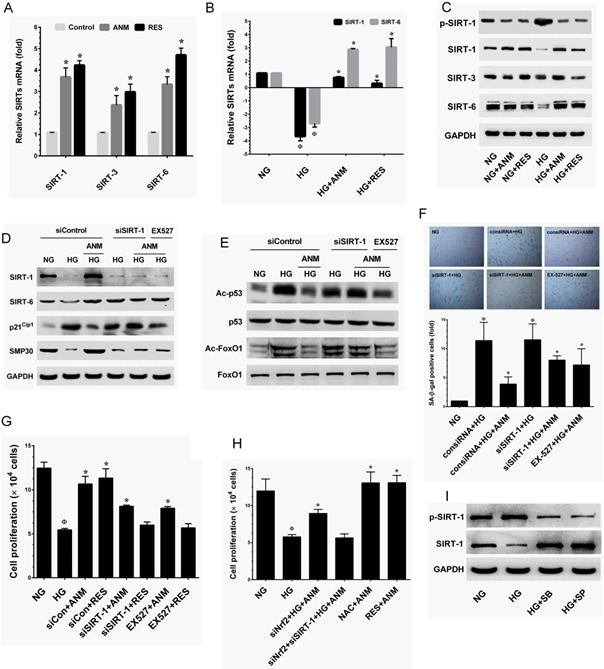
Figure 7. Antcin M upregulates SIRT-1 in HNDFs.

A. HNDFs were incubated with ANM (10 μM) or RES (5 μM) for 72 h. B. HNDFs were exposed to HG in the prsence or absence of ANM (10 μM) or RES (5 μM) for 72 h. Total RNA was extracted and subjected to Q-PCR analysis to monitor SIRT-1, SIRT-3 and SIRT-6 expression. Relative mRNA levels were normalized by β-actin mRNA. C. HNDFs were incubated with ANM (10 μM) or RES (5 μM) in the presence or absence of HG (30 mM) for 72 h. Total cell lysate was extracted and subjected to western blot analysis to monitor SIRT-1, SIRT-3, SIRT-6 protein levels. D., E. HNDFs were transfected with siRNA against SIRT-1 or control siRNA for 24 h or inhibited by SIRT-1 inhibitor EX527 (5 μM), and then treated with ANM (10 μM) or RES (5 μM) in the presence of HG for 72 h. The protein expression levels of SIRT-1, SIRT-6, p21CIP1, SMP30, p53, FoxO and acetylation of p53 and FoxO1 were determined by western blot analysis. F., G. Under the same conditions, cellular senescence and cell proliferation were measured by SA-β-gal activity assay and tryphan blue exclusion assay, respectively. H. HNDFs were transfected with siNrf2 or a combination of siNrf2 and siSIRT-1, and then incubated with ANM in the presence or absence of HG for 72 h. Cell proliferation was determined by tryphan blue exclussion assay. I. Cells were incubated with JNK/SAPK or p38 MAPK inhibitors SP600125 (SP, 30 μM) and SB203580 (SB, 30 μM) in the presence of HG for 72 h. The protein expression levels of phos-SIRT-1 and SIRT-1 were determined by western blotting. Results expressed as mean ± S.E.M of three indipendent expriments. Statistical significance at Ф, P < 0.05 compared to NG vs HG and *P < 0.05 compared to HG vs. samples.
