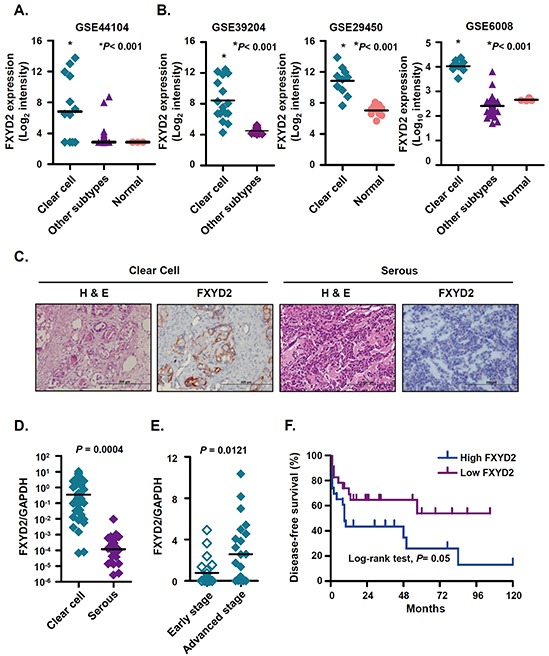
Figure 1. FXYD2 is highly expressed in ovarian clear cell cancer.

A. and B. the mRNA expression levels of FXYD2 were compared in clinical ovarian cancer specimens from our Affymetrix GeneChip HG-U133_Plus_2 analysis (GSE44104) and three GEO databases. All of the specimen groups were compared to clear cell ovarian cancer group using one-way ANOVA followed by Bonferroni multiple comparisons test. C. representative images of immunohistochemical analysis of FXYD2 in ovarian cancer sections. Consecutive sections were stained with hematoxylin and eosin (H&E) to define representative tumor regions. Magnification ×200. Scale bar, 200 μm. Comparison of FXYD2 mRNA expressions in clinical ovarian cancer specimens (D. clear cell, n = 46; serous, n = 28) and (E. early, stage 1 and 2, n=22; advanced, stage 3 and 4, n=24). The FXYD2 expression levels were determined by qRT-PCR and normalized to GAPDH expression. All of the qRT-PCR data presented is from three independent experiments that were analyzed using an unpaired t test. F. Kaplan-Meier survival plots for patients with ovarian clear cell carcinoma (n = 46) according to FXYD2 mRNA expression. The FXYD2 mRNA levels were measured by qRT-PCR and normalized to the GAPDH expression. The median value was used to divide patients into high (n = 23) and low (n = 23) FXYD2 expression groups. Statistical comparison of Kaplan-Meier curve was analyzed by the log-rank test.
