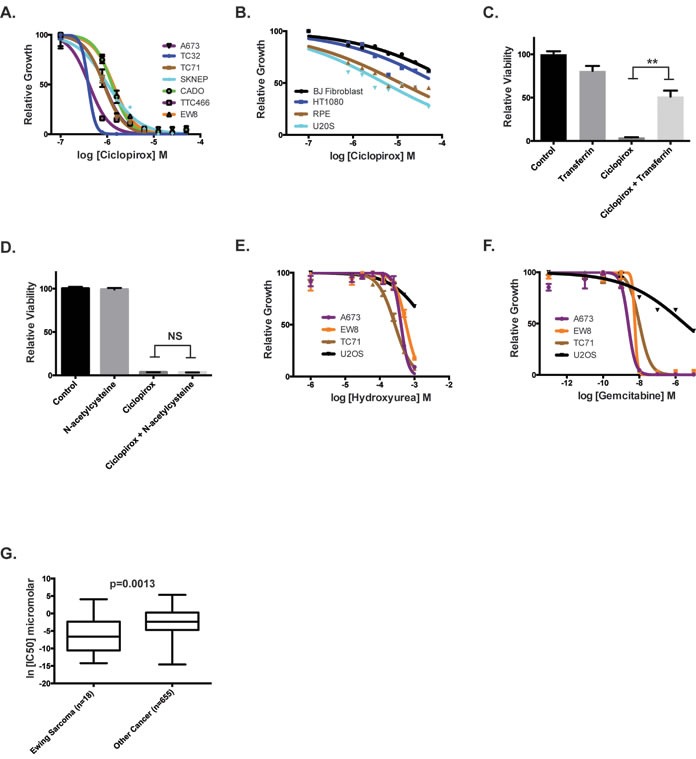
Figure 3. Inhibitors of ribonucleotide reductase impair the growth of Ewing sarcoma cells.

A. Dose-response curves for seven Ewing sarcoma cell lines treated with different concentrations of ciclopirox for three days. Cell viability was assessed using the CellTiter-Glo Luminescent Assay. B. Dose-response curves for non-Ewing sarcoma cell lines treated with different concentrations of ciclopirox for three days. C. Relative viability of A673 cells treated with transferrin, ciclopirox and the combination of ciclopirox and transferrin. D. Relative viability of A673 cells treated with N-acetylcysteine, ciclopirox and the combination of ciclopirox and N-acetylcysteine. E. Dose-response curves for Ewing sarcoma cell lines treated with different concentrations of hydroxyurea for three days. F. Dose-response curves for Ewing sarcoma cell lines treated with different concentrations of gemcitabine for three days. G. Analysis of Genomics of Drug Sensitivity in Cancer data shows that Ewing sarcoma cell lines are more sensitive to gemcitabine than other cancer cell lines. For the dose-response experiments, the results are representative of three independent experiments. Error bars represent mean ± SD of three technical replicates. ** P-value < 0.01.
