
Figure 5. Knockdown of RRM2 using siRNA impairs the viability of Ewing sarcoma cells.
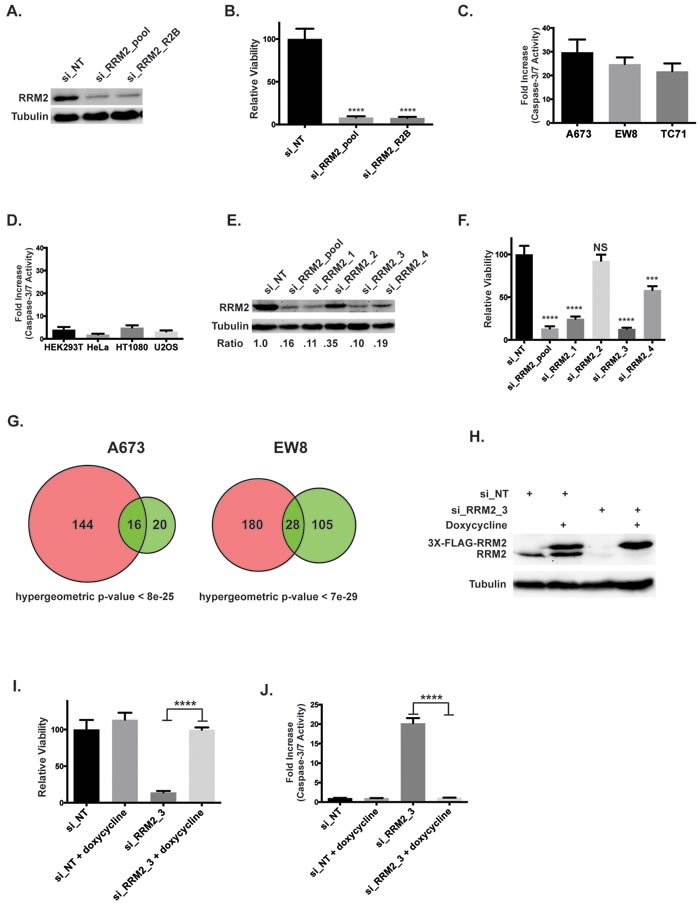
A. Western blot showing levels of the RRM2 protein in A673 cells after transfection with two different siRNAs targeting RRM2 or a non-targeting siRNA (si_NT). B. Relative viability of A673 cells treated with a non-targeting siRNA or the two siRNAs that target RRM2. C., D. Increase in caspase-3/7 activation in Ewing sarcoma cells lines C. and non-Ewing sarcoma cell lines D. treated with siRRM2_R2B or si_NT for three days. Results are plotted as the fold increase in caspse-3/7 activity in the cells treated with siRRM2_R2B compared to the cells treated with si_NT. E. Western blot showing levels of the RRM2 protein after transfection with si_RRM2_pool or the individual siRNAs that compose the pool set. The relative expression level of RRM2 for each siRNA compared to the non-targeting siRNA is shown below the plot. F. Relative viability of A673 cells transfected with si_NT, si_RRM2_pool and the individual siRNAs that compose the pool (1-way ANOVA, Dunnett's post hoc test) G. Venn diagram demonstrates the overlap between genes deregulated by ciclopirox (pink) and si_RRM2_R2B (green). H. Western blot showing that the exogenous, doxycycline-inducible RRM2 gene, which is labeled with a 3X-FLAG tag, is resistant to knockdown by si_RRM2_3. I. Relative viability of EW8 cells with doxycycline-inducible expression of siRNA-resistant RRM2 after transfection with si_RRM2_3. Cell viability was assessed using the CellTiter-Glo Luminescent Assay. J. Increase in caspase-3/7 activation in EW8 cells with doxycycline-inducible expression of siRNA-resistant RRM2 after transfection with si_RRM2_3. Fold change is relative to the si_NT cells. Data B., C., D., F., I., J. represent mean ± SD, n = 3. *** p -value < 0.001, **** p -value < 0.0001.