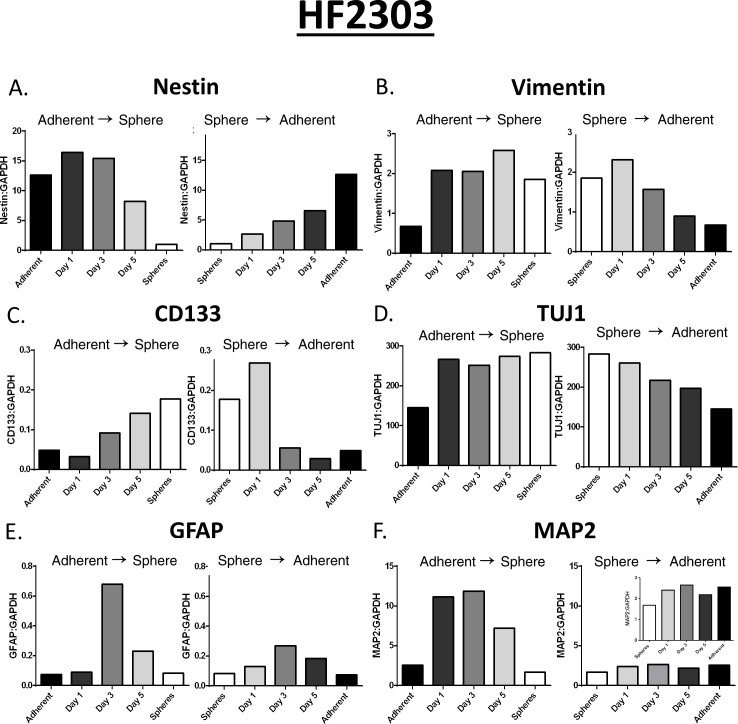
Figure 7. Several of the mRNAs (ie. Nestin, Vimentin, CD133, TUJ1) measured changed depending on the state of the cell (Figure 7A-D).
The remainder of the mRNAs (GFAP, MAP2) did not change between phenotypes but seemed to spike in the middle of the transition between phenotypes (Figure 7E-F). ΔΔCt Values were shown for mRNA readings in this figure.

