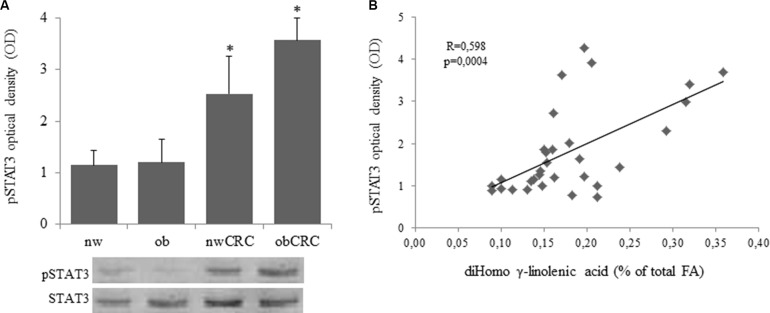
Figure 4. Over-expression of phospho-STAT3 in adipocytes from CRC patients and correlation with DGLA content.
(A and B): Human visceral adipocytes, collected from the four groups of subjects, were serum-starved for 18 hours. Whole cell extracts were separated by SDS-PAGE and analyzed using anti-phospho-STAT3 (pSTAT3) antibody. Results were normalized to STAT3 protein content and expressed as optical density (OD), and representative blots are shown. Mean ± SEM is shown for each subject group. Differences among the four groups were evaluated by ANOVA. *p < 0.01, nwCRC and ObCRC vs nw or ob.

