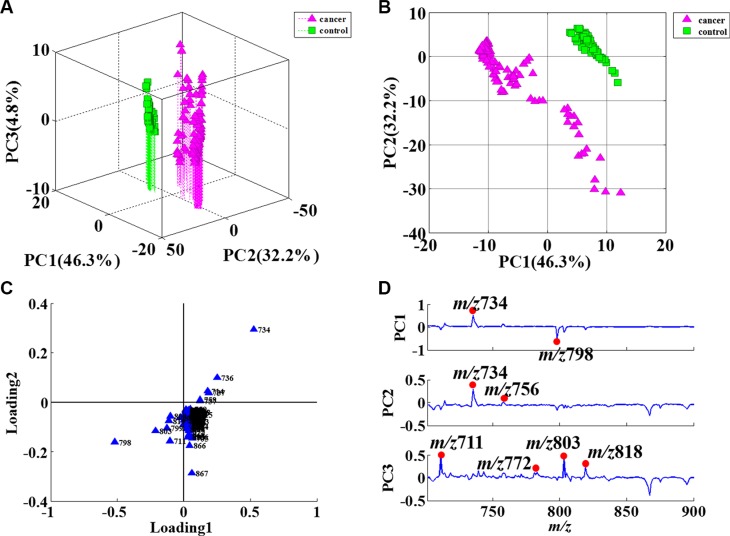
Figure 2. PCA results of sputum in positive ion mode.
(A) 3D plot of PCA score results; (B) 2D plot of PCA score results; (C) Contribution degree of ions in loading1 and loading2; (D) PCA loading results for the PCs. The main differences were in the m/z 711, m/z734, m/z756, m/z772, m/z798, m/z803 and m/z818 ions.

