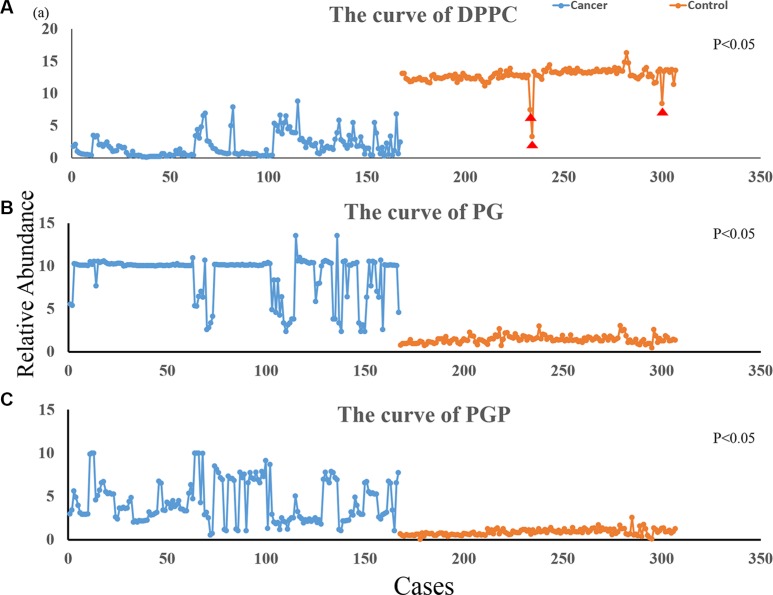
Figure 4. Variation curve for differential ions.
The blue line represents the relative abundance of ions in NSCLC sputum and the orange line represents the abundance of ions in control sputum; (A) is the curve of DPPC (1.83 ± 3.18 vs. 12.78 ± 1.55; P < 0.05); (B) is the curve of PG (8.92 ± 6.53 vs. 1.42 ± 0.19; P < 0.05); (C) is the curve of PGP (4.35 ± 6.18 vs. 0.81 ± 0.09; P < 0.05); (DPPC were the sum of the m/z734, m/z756 and m/z772 ions, PG was m/z798 ion and PGP was m/z803 ion). Indicates the contols with values that are significantly lower than the average; these may be high-risk cases of lung cancer, and we intend to follow-up these individuals.

