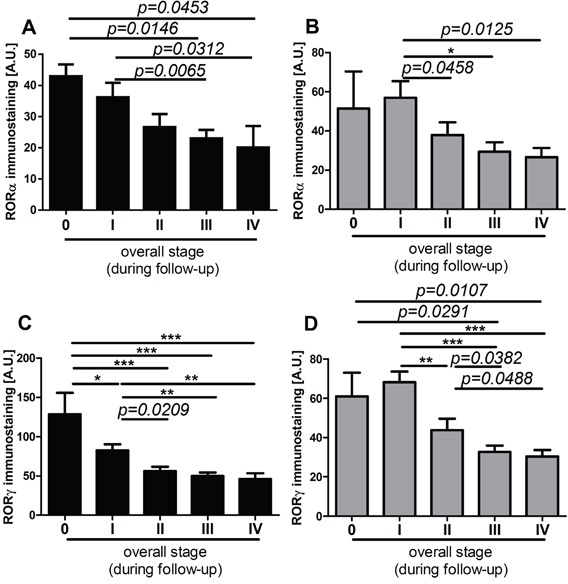
Figure 10. The mean level of nuclear (A, C) and cytoplasmic (B, D) RORα (A, B) and RORγ (C, D) in primary melanomas stratified according to the disease stage assessed during follow-up of patients.

Statistically significant differences are denoted with P values as determined by Student's t-test and with asterisks by ANOVA (*P<0.05, **P<0.01 and ***P<0.001).
