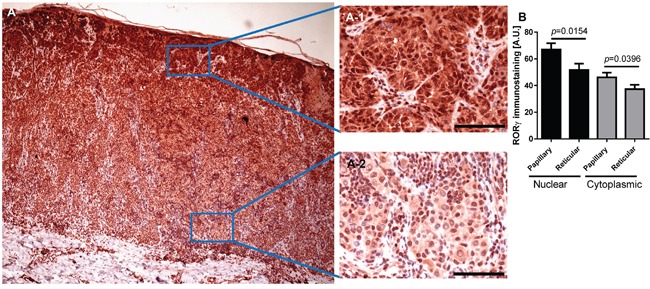
Figure 12. Representative immunostaining of RORγ in melanoma.

RORγ expression gradually decreased with increasing melanoma depth (A) A-1 and A-2 represent fragments indicated by squares in Figure (A) Scale bars - 100μm. (B) Mean nuclear (black bars) and cytoplasmic (gray bars) RORγ immunostaining in melanoma cells within the papillary and reticular dermis. Statistically significant differences are denoted with P values calculated with t-test.
