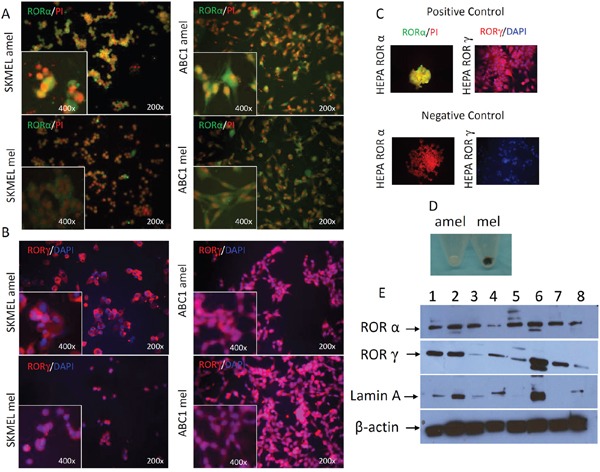
Figure 5. Changes in RORα and RORγ expression pattern in cultured melanoma cells after induction of melanogenesis.

F-ICC, RORα expression (green) in SKMEL amelanotic (amel), SKMEL melanotic (mel), ABC1 amelanotic (amel) and ABC1 melanotic (mel); PI was used to counterstain nuclei (A). F-ICC, RORγ expression (red) in SKMEL amel, SKMEL mel, ABC1 amel, ABC1 mel; DAPI used to counterstain nuclei (B). Examples of positive and negative controls (C). The differences in pigmentation between melanotic (mel) and amelanotic (amel) SKMEL cells (D). WB analysis of RORα and RORγ expression (E). Proteins were extracted separately from cytoplasm (1, 3, 5, 7) and nucleus (2, 4, 6, 8) of human SKMEL (amelanotic 1-2, melanotic 3-4), hamster AbC1 (melanotic 5-6) melanomas and HEPA cells as a positive control (7-8) and stained with antibodies against RORα, RORγ. Arrows in two upper panels show proteins with an expected molecular mass of ~67 kDa for RORα and of ~63 kD for RORγ. Two lower panels show, respectively, stains for Lamin A (nuclear marker) and β-actin (expressed in both compartments), which were used as loading controls (E).
