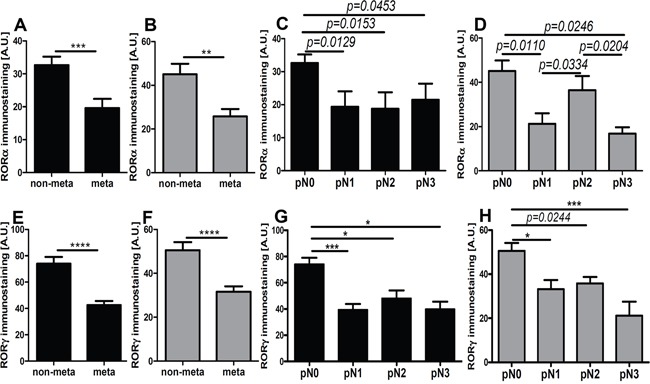
Figure 9. The mean level of nuclear (A, C, E, G) and cytoplasmic (B, D, F, H) RORα (A-D) and RORγ (E-H) in primary melanomas stratified according to the presence of metastases presence and pN status.

Statistically significant differences are denoted with P values as determined by Student's t-test and with asterisks by ANOVA (*P<0.05, and ***P<0.001).
