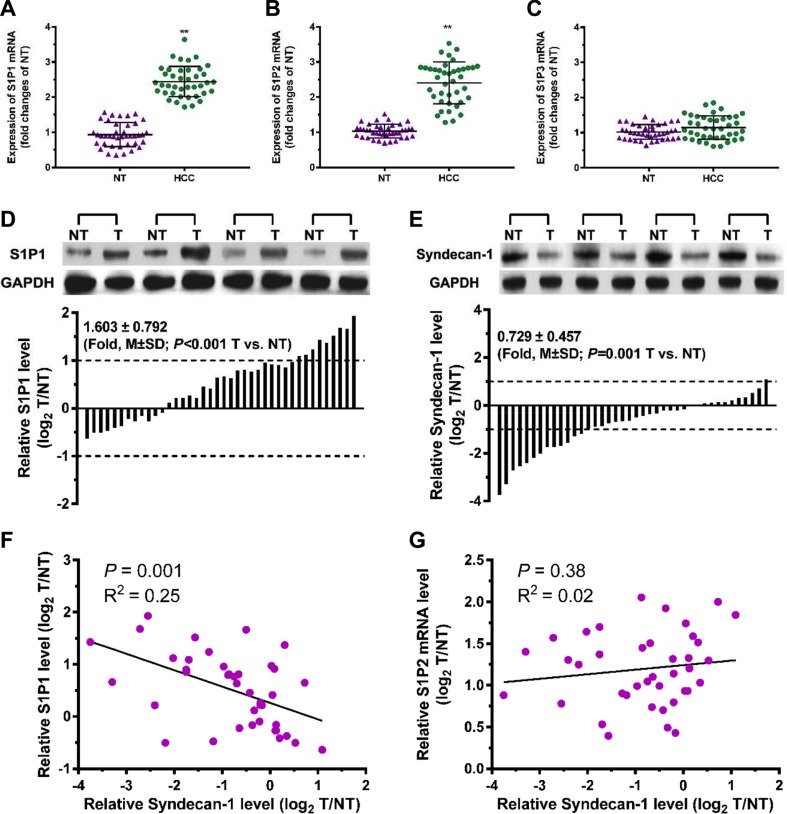
Figure 2. A correlation exists between S1P1 and syndecan-1 in HCC and para-carcinoma tissues.
(A), (B) and (C), mRNA expressions of S1P1 (A), S1P2 (B), and S1P3 (C) were measured by qRT-PCR assays in 40 pairs of HCC and their adjacent non-carcinoma tissues (NTs). The results are shown as the median of triplicate determinations for each sample. The lines indicate Mean ± S.D. Asterisks indicate significance at **P < 0.01 (ANOVA). (D) and (E), immunoblottings for S1P1 (D) and syndecan-1 (E). Protein levels were determined by Western blot in pairs of HCC (T) and NTs. If log2 fold change (log2 T/NT) more than 1 or less than -1, the expressions of S1P1 and syndecan-1 were considered overexpression or suppression, respectively. (F) and (G), correlations between S1P1 and syndecan-1 (F), and between S1P2 mRNA and syndecan-1 (G) were determined.

