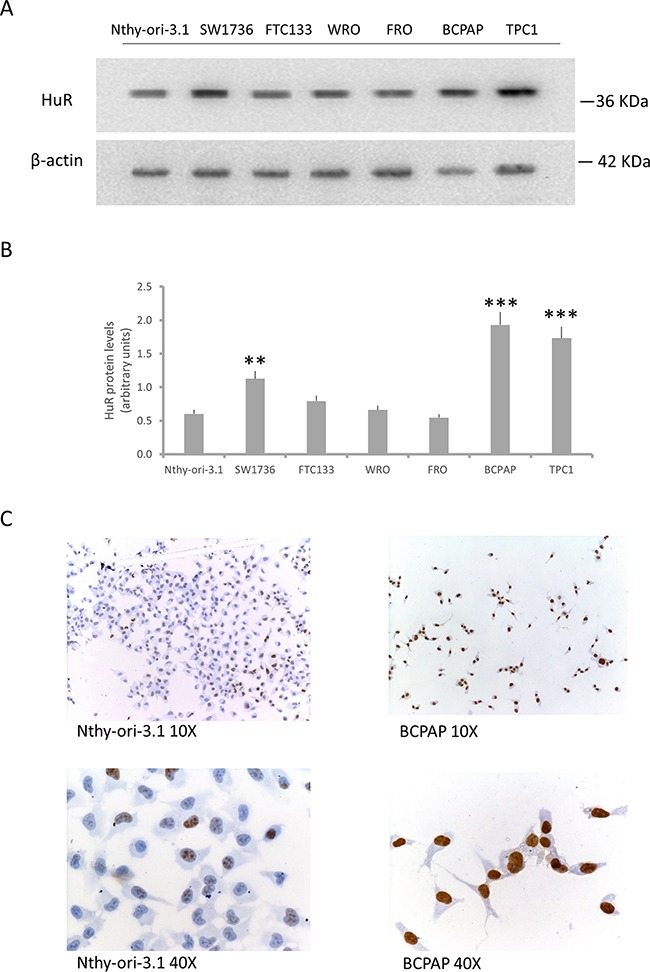
Figure 2. HuR expression in thyroid cell lines.

Panel A. Western blot analysis of HuR expression in a non-tumorigenic thyroid cell lines (Nthy-ori-3.1) and in six tumorigenic ones (SW1736, FTC133, WRO, FRO, BCPAP and TPC1). Panel B. Densitometric analysis of HuR protein levels in thyroid cell lines. Panel C. Immunocytochemical staining of Nthy-ori-3.1 and BCPAP cells. The brown signal indicates HuR positivity. Results are shown as mean ± SD. * p < 0.05, ** p < 0.01, **** p < 0.0001 by ANOVA test.
