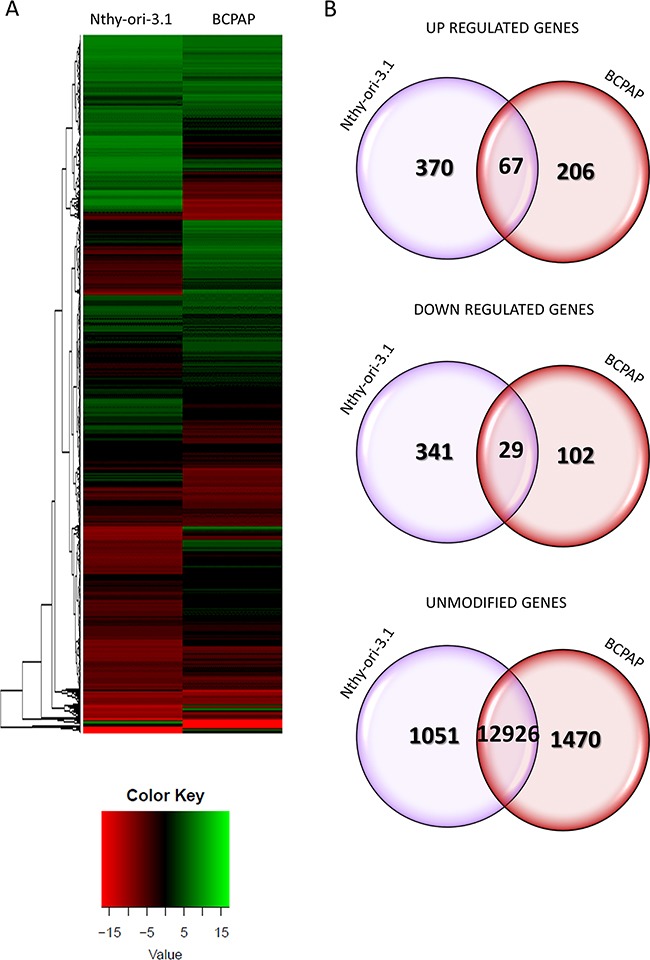
Figure 4. HuR silencing effects on gene expression.

Panel A. Heat maps showing the hierarchical clustering of RNA targets in Nthy-ori-3.1 and BCPAP cell lines. Cells were treated either with siRNA1 or negative control for 72 hours. Results are showed as siRNA1 compared to control transfected cells. Panel B. Venn diagrams represented the comparison of up-regulated, down-regulated and unmodified genes between Nthy-ori-3.1 and BCPAP cell lines after RNA-seq data analysis. The overlap of Nthy-ori-3.1 and BCPAP circles in Venn diagrams indicated shared modified genes between Nthy-ori-3.1 and BCPAP cell lines.
