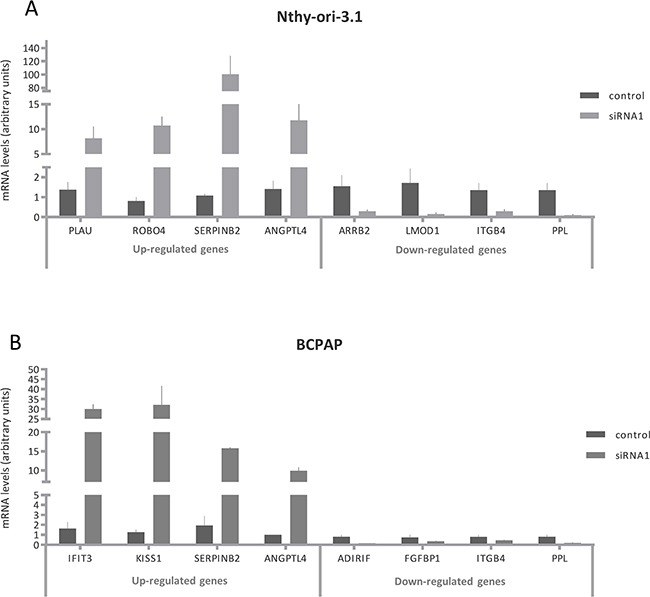
Figure 5. Validation of HuR silencing effects on gene expression.

Relative expression levels of PLAU, ROBO4, SERPINB2, ANGPTL4, ARRB2, LMOD1, ITGB4, PPL, IFIT3, KISS1, ADIRIF and FGFBP1 after HuR silencing. RNA extraction and real time PCR are described in Materials and Method section. For each cell lines, the results were normalized against β actin and expressed in arbitrary unit, calculated as described in Materials and Methods section. Results are shown as mean ± SD of three different experiments. All silenced cell data were statistical significant compared to untreated cells.
