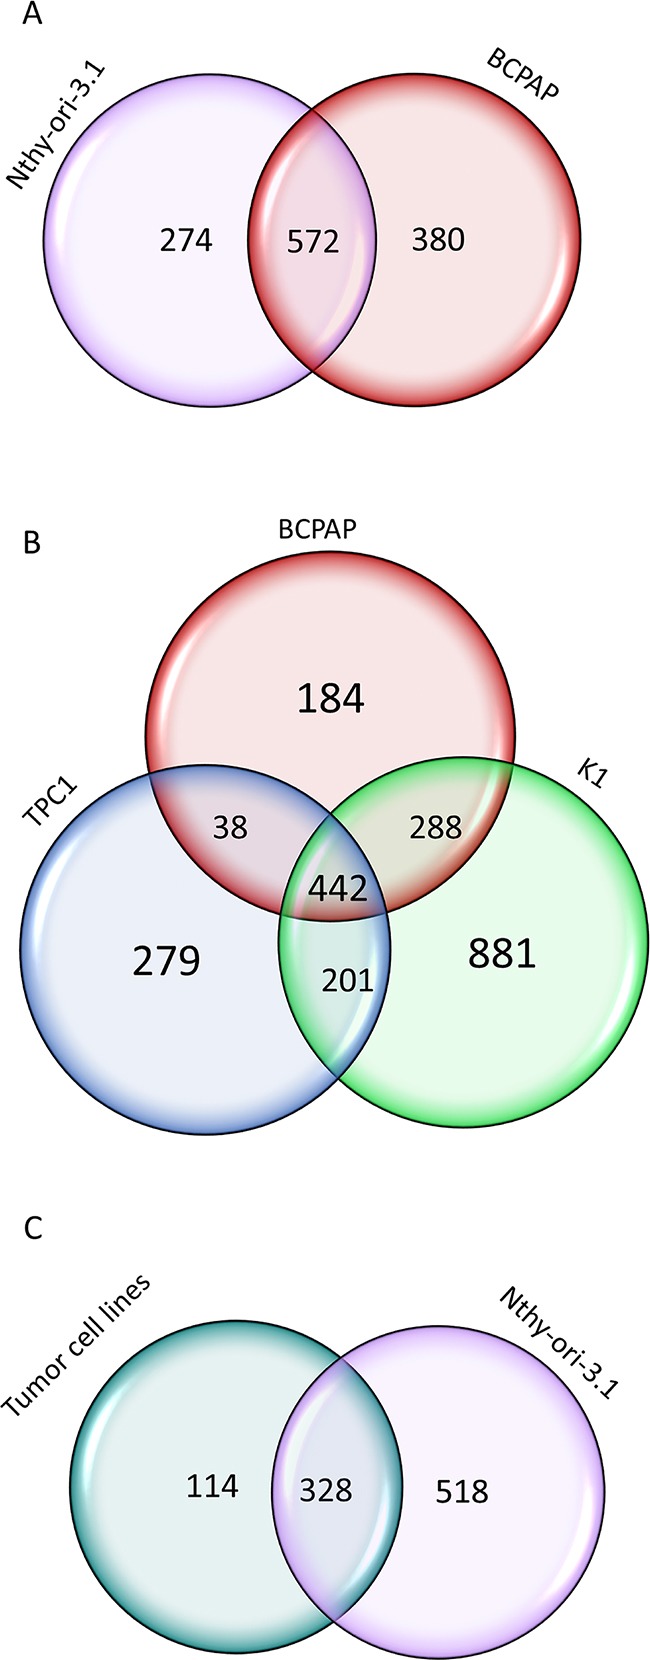
Figure 6. HuR-bound RNAs in thyroid cell lines.

Panel A. Venn diagrams representing the comparison of HuR RNA target identified in Nthy-ori-3.1 and BCPAP cells by RIP-seq analysis. Panel B. Venn diagrams representing the comparison of HuR RNA target identified in three PTC cell lines: BPCAP, K1 and TPC1 by RIP-seq analysis. Panel C. Venn diagrams representing the comparison of HuR RNA target identified in tumorigenic and non-tumorigenic cell lines.
