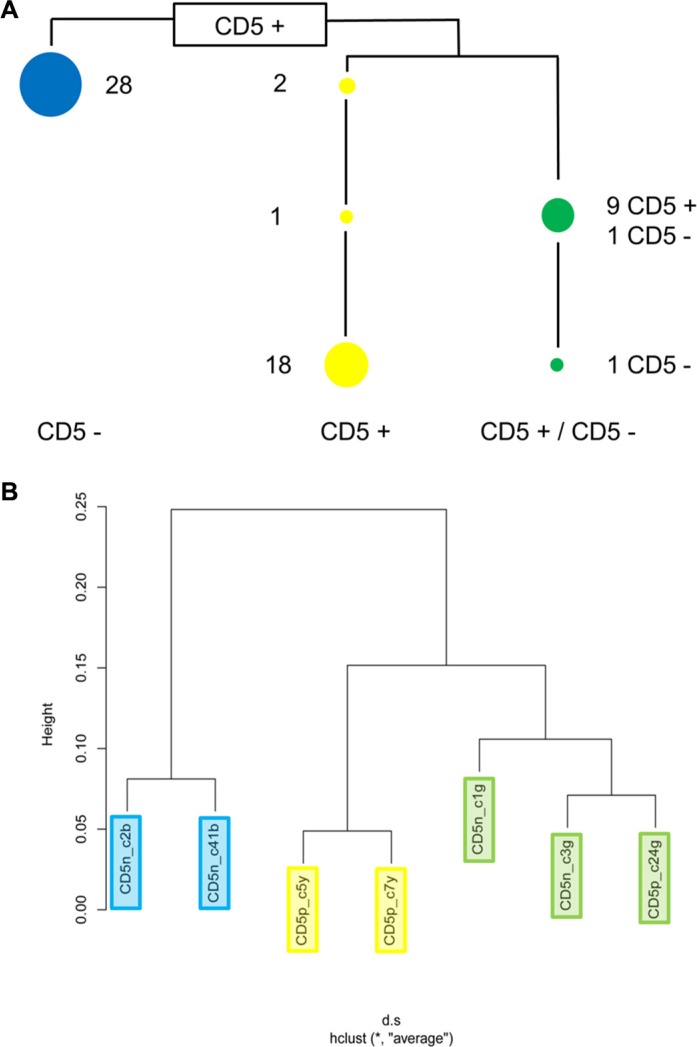
Figure 4. Clonal structure of cell line HG3.
(A) ARMS assays showing that cell line HG3 comprises three clonal lineages. Numbers indicate how many of the sixty single cell clones tested carry lineage- and stage-specific mutations. The blue lineage is CD5−, the yellow lineage is CD5+. Single cell clones of the green lineage carrying fewer mutations are CD5+, clones with higher numbers of mutations are CD5−. Supplementary Table S4 shows the mutational status of the individual single cell clones. (B) Unsupervised clustering of expression array data from seven randomly chosen single cell clones revealed the same clonal structure as the mutational analysis.

