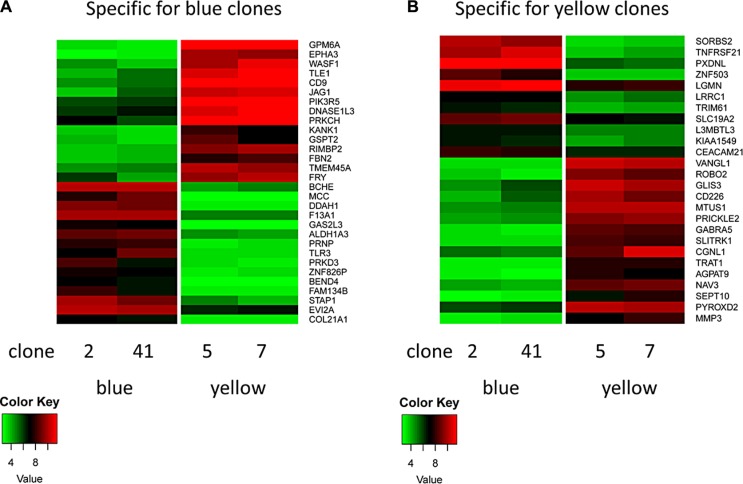
Figure 6. Heatmap of clone-specific genes.
(A) Clones of the blue lineage show a typical set of high (e.g. BCHE) and low genes (e.g. GPM6A). Clones of the green (not shown) and yellow lineages show the inverse pattern. (B) Clones of the yellow lineage show a typical set of high (e.g. VANGL1) and low genes (e.g. SORBS2). Clones of the green (not shown) and blue lineages show the inverse pattern.

