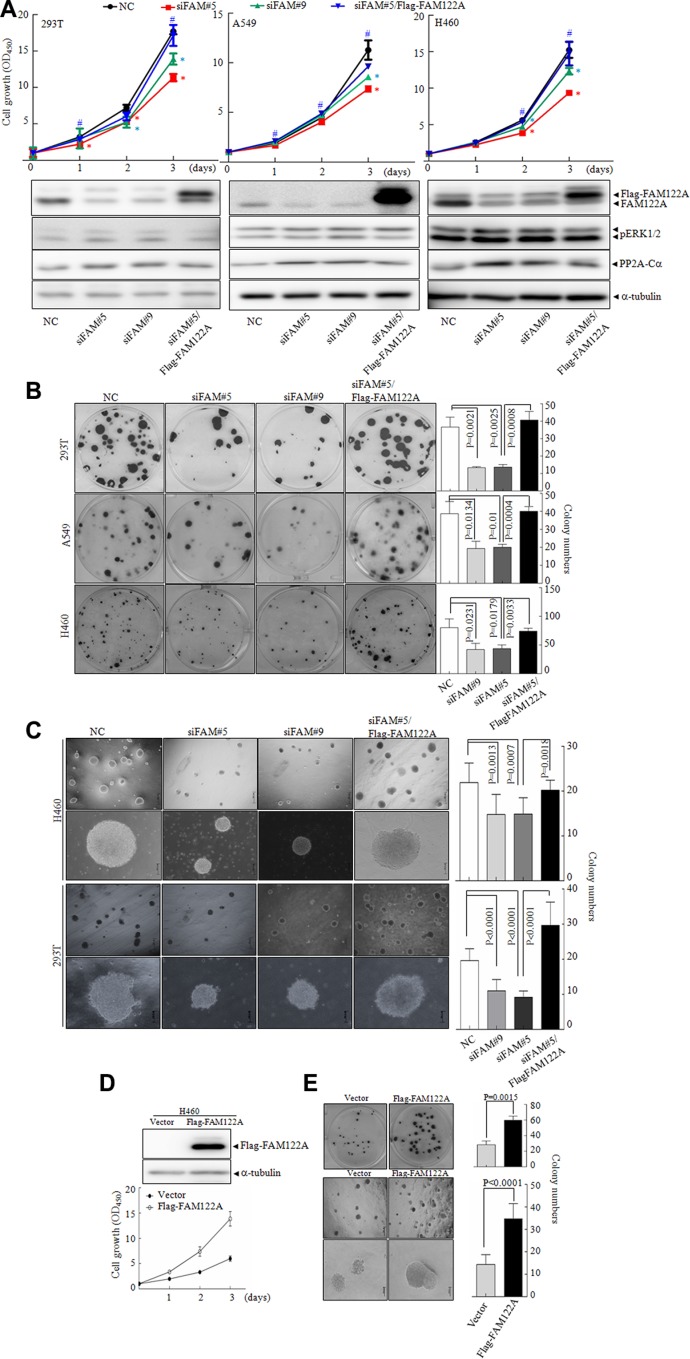
Figure 6. The effects of FAM122A on cell growth and colony formation.
(A) Three indicated FAM122A silencing cells together with the stable expression of Flag-FAM122A in siFAM#5 expressing cells were respectively cultured and cell growth was monitored. Data indicate means with bar as S.D of triplicate samples in an independent experiments. The symbol * indicated p < 0.05 compared with NC cells and the symbol # implied p < 0.05 compared with that of siFAM#5 expressing cells. The indicated proteins were tested with the corresponding antibodies. (B, C) The cells were cultured in plates (B) and in soft agar (C) for two weeks to observe the colony formation. (D–E) The cell growth was examined in ectopically expressing Flag-FAM122A and empty H460 cells by CCK-8 (D), plate colony (the upper panel of E) and soft agar colony formation (the bottom panels of E). The graphs on right panel were statistically analyzed. The scale bar represents 500 μm (top row) or 100 μm (bottom row) in H460 and 293T cells (C and bottom panels of E).

