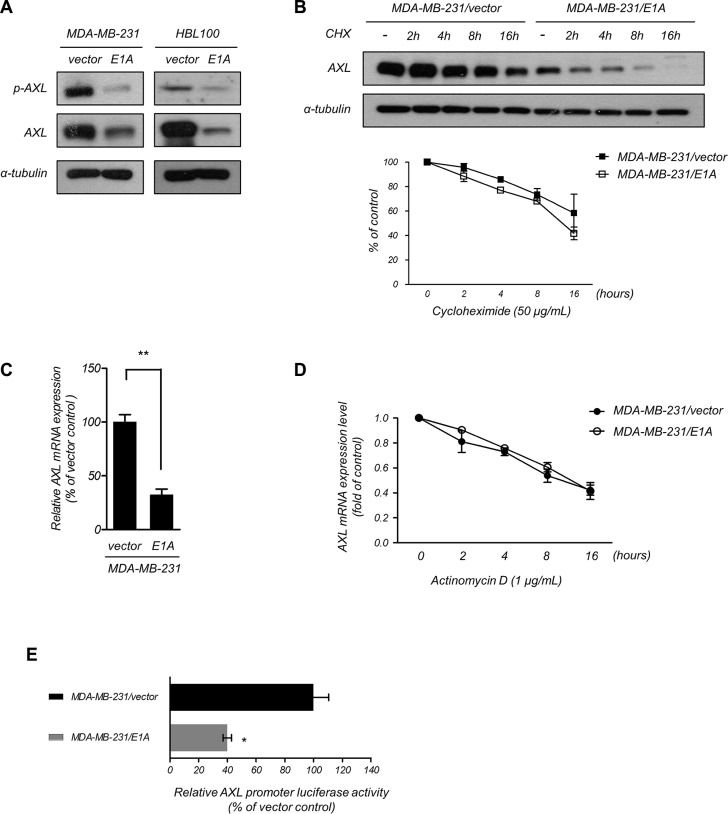
Figure 4. E1A transcriptionally downregulates AXL.
(A) Phosphorylation of AXL and AXL expression was assessed in E1A-expressing and vector-expressing MDA-MB-231 and HBL100 cells using western blotting analysis. α-Tubulin was used as an internal control. (B) The protein level of AXL was examined using western blotting analysis in MDA-MB-231/vector and MDA-MB-231/E1A cells treated with cycloheximide (50 μg/ml, CHX) at the indicated times and quantified (bottom). α-Tubulin was used as the internal protein loading control. The results are representative of at least 3 independent experiments. Bars indicate means ± s.e.m. (C) The relative AXL mRNA expression of MDA-MB-231/vector and MDA-MB-231/E1A cells was analyzed using qRT-PCR. The data were normalized to GAPDH mRNA levels in each sample. The columns represent the mean values from 3 independent experiments. Bars indicate the means ± s.e.m. **P < 0.01. (D) The mRNA level of AXL was determined using qRT-PCR in MDA-MB-231/vector and MDA-MB-231/E1A cells treatment with actinomycin D (1 μg/ml) at the indicated time points, and quantities were presented as fold changes compared with MDA-MB-231/vector cells. (E) Luciferase reporter assays used −1,251 to +475 flanking the TSS of AXL gene. The MDA-MB-231/vector and MDA-MB-231/E1A cells were transfected with the promoters, and luciferase activity was measured after transfection for 48 h. The pTK-Renilla plasmid was used as an internal control. Bars indicate the means ± s.e.m. *P < 0.05.

