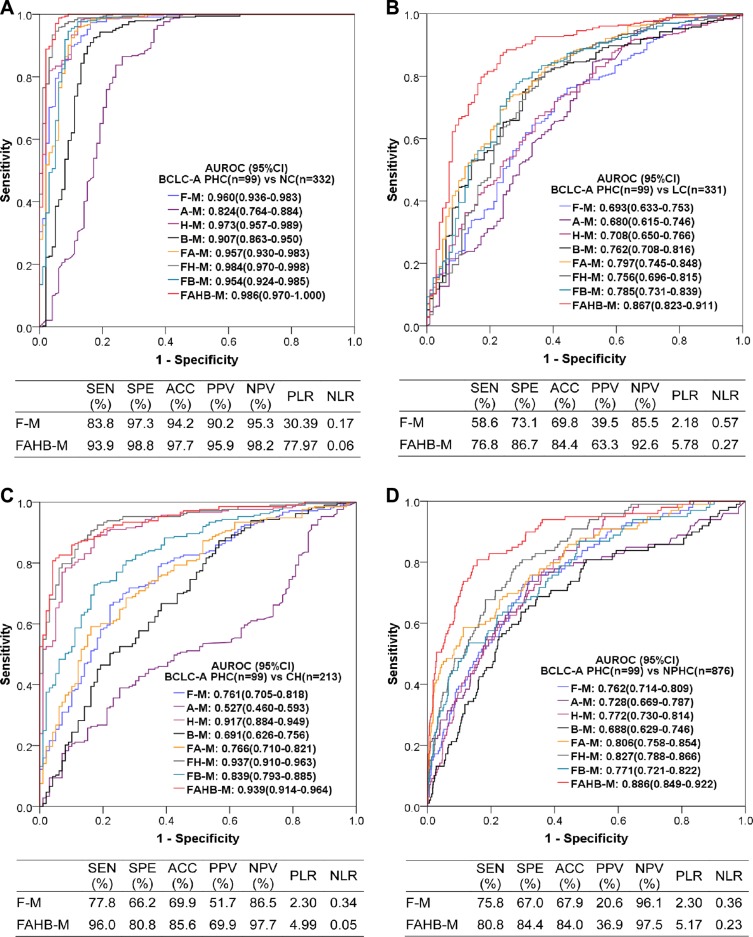
Figure 6. Diagnostic value of the models for diagnosing PHC at BCLC stage A vs. NC.
(A), LC (B), CH (C) and NPHC (D). AUROC: area under the receiver operating characteristic (ROC) curve; CI: confidence interval; BCLC-A: Barcelona Clinic Liver Cancer stage A; PHC: primary hepatic carcinoma; NC: normal control; LC: liver cirrhosis; CH: chronic hepatitis; NPHC: non-primary hepatic carcinoma (NC+LC+CH). Each model name is a combination of abbreviations representing fluorescence intensity(F), alpha-fetoprotein (A), hepatic function test results (H) and/or blood cell analyses (B) with the model (−M), which indicate the covariates used during modeling; for example, FAHB-M was established with indicators of fluorescence intensity, alpha-fetoprotein, hepatic function test results and blood cell analyses. SEN: sensitivity; SPE: specificity; ACC: accuracy; PPV: positive predictive value; NPV: negative predictive value; PLR: positive likelihood ratio; NLR: negative likelihood ratio.

