
Figure 2. The properties of pan-cancer ceRNA molecules.
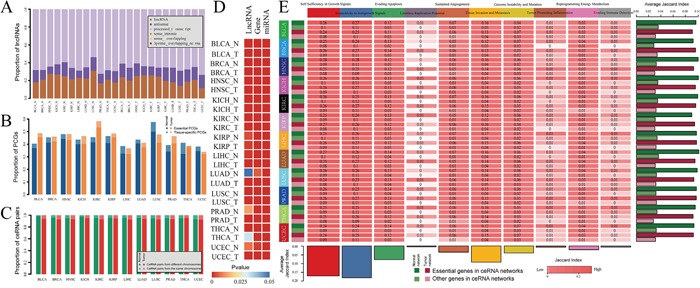
A. Proportion of lncRNAs in pan-cancer ceRNA networks that involved in each lncRNA class. B. Proportion of PCGs in pan-cancer ceRNA networks that are tissue specific and essential genes. C. Chromosome distribution of lncRNA-mRNA ceRNA pairs across 12 cancers. Dark green (light green) represent percent of ceRNA pairs in which lncRNA and PCG located in different (same) chromosome in normal ceRNA networks. Dark red (light red) represent percent of ceRNA pairs in which lncRNA and PCG located in different (same) chromosome in tumor ceRNA networks. D. P-value of hypergeometric test that evaluated significance of lncRNAs, PCGs and miRNAs that mediated ceRNA interactions enriched in the corresponding cancer related molecule (lncRNA/miRNA/PCG) sets. E. Jaccard coefficient matrix for PCGs in pan-cancer ceRNA networks and cancer hallmark processes.