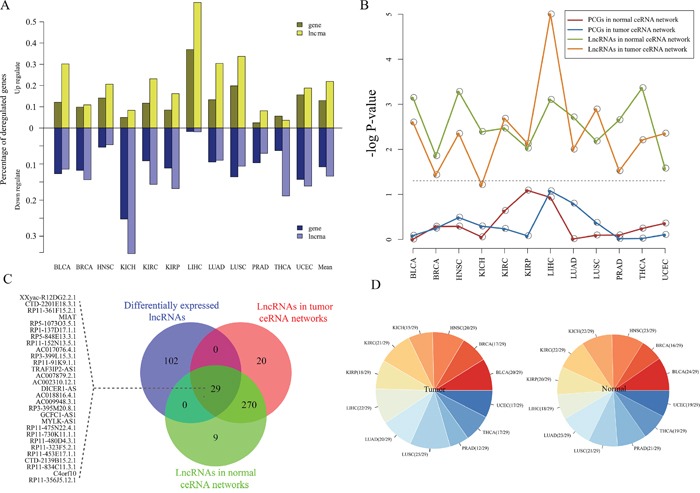
Figure 3. Expression analysis of pan-cancer ceRNA networks.

A. The percentages of the dysregulated lncRNAs and PCGs across 12 cancer types. Dysregulated lncRNAs and PCGs were determined by these Fold change (>2 or <1/2) by comparing normal and tumor samples for each cancer type. B. Statistical significance of dysregulated lncRNAs and PCGs that are enriched in ceRNA networks, which evaluated by using hypergeometric test. Gray dotted line correspond to the 5% significance level. C. Venn plot for dysregulated lncRNAs, and lncRNAs in the pan-cancer ceRNA networks. D. Distribution of these 29 shared lncRNA among three lncRNA sets in (B) in each cancer ceRNA network. The left (right) panel represents the distribution of these 29 lncRNAs in 12 tumor (normal) ceRNA networks.
