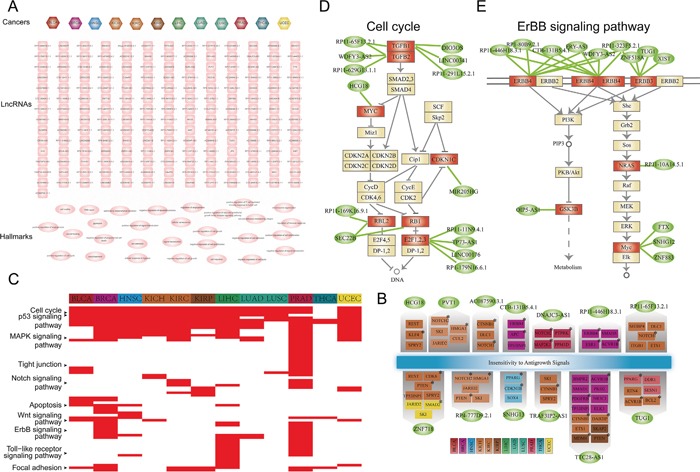
Figure 7. Functional analysis for lncRNAs that participate in cancer specific ceRNA interactions.

A. Thecancer-lncRNA-hallmark hierarchical network. An edge between a cancer node and lncRNA node represent the lncRNA participates specific ceRNA pair(s) of the corresponding cancer type. An edge between lncRNA and cancer hallmark represent PCGs that specifically competing with the given lncRNA were enriched in the cancer hallmark process (P<0.05). Hexagon nodes represent cancer, rectangle nodes represent lncRNA and ellipses nodes are cancer hallmarks. B. Thirteen lncRNAs in (A) regulated ‘Insensitivity to Antigrowth Signals’ hallmark process through distinct genes in different cancers. Protein coding genes (PCGs) were colored according cancer type in which it specifically interacted with the corresponding genes. Cancer PCGs were marked by star. Ellipses nodes with green color represent lncRNAs, rectangle nodes represent PCGs. C. Pathway enrichment analysis for PCGs involved in cancer specific ceRNA pairs. In the heat map, the corresponding cell was colored red if PCGs involved in this cancer type specific ceRNA pairs were significantly enriched in the pathway. D. LncRNAs cooperatively regulated the cell cycle pathway in PRAD. Ellipses nodes with green color represent lncRNA, rectangle nodes with red color represent genes were competitively regulated by lncRNAs, while yellow node represent pathway genes. E. Similar with (D), but ErBB signaling pathway for BRCA.
