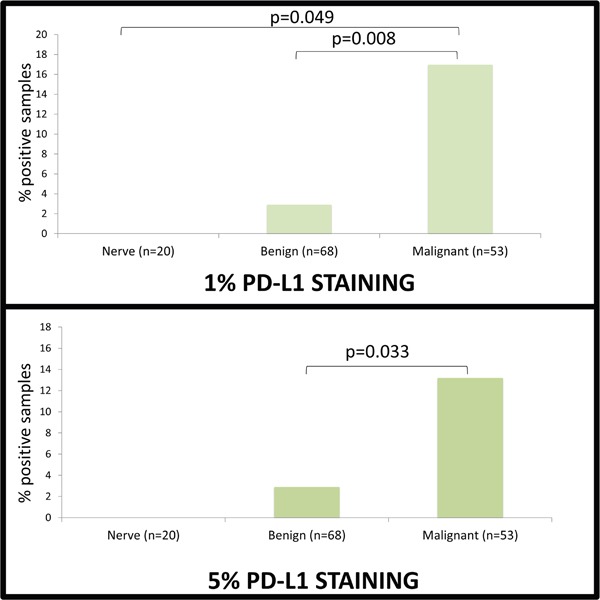
Figure 1. PD-L1 Expression.

1-5 cores from different blocks were stained for PD-L1, PD-1 and CD8+ and scored based on intensity of staining on a scale of 0-3 and percent of cells staining positively. Significance of staining differences between groups was compared via chi squared analysis and survival analysis was performed using a Cox proportional hazards model. PD-L1 staining of at least 1% was seen in 0/20 nerves, 2/68 benign lesions and 9/53 malignant lesions. PD-L1 staining of at least 5% was seen in 0/20 nerves, 2/68 benign lesions and 7/53 malignant lesions. PD-L1 was statistically more prevalent in MPNST than both nerves and benign lesions (p=0.049 and p=0.008, respectively) at the 1% level, but only benign lesions at the 5% level (p=0.033).
