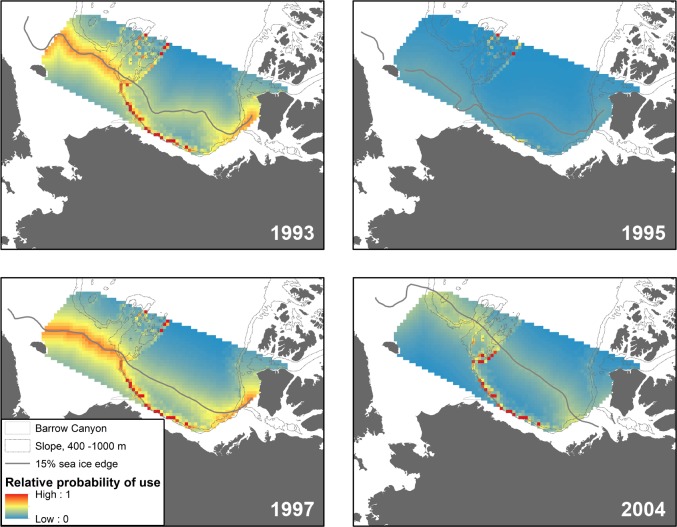
Fig 4. Maps of predicted Beaufort male beluga whale use in September, for years when Beaufort males were tagged (see Table 1).
These four years were averaged to produce the map of September Beaufort male relative probability of use in Fig 3. The sea ice edge, derived from monthly ice concentration grids [31], are shown for each year.

