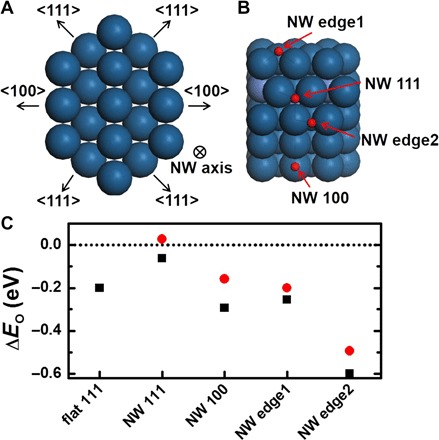
Fig. 6. DFT calculations of EO.

(A) Atomic model of the single crystalline NW with four (111) facets and two (100) facets. (B) Four stable adsorption sites for oxygen on the NW. Red spheres represent oxygen atoms. (C) ΔEO on flat Pt (111) surface and Pt-based NWs. The black squares and red circles correspond to ΔEO values on the pure Pt and PtNi NW, respectively. The horizontal dashed line indicates the optimal ΔEO value.
