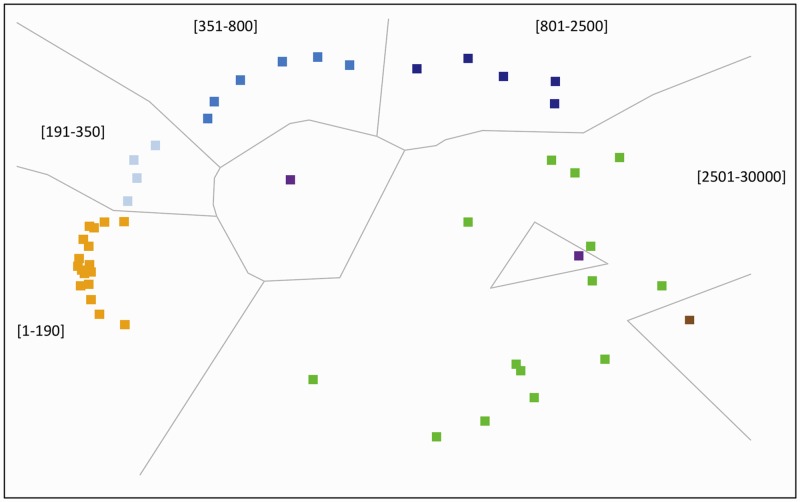
Fig 2. Multi-dimensional scaling of the pain adjusted MIPs.
The figure shows the coherent tight clustering of counts per-minute intervals within certain ranges. There is clear segregation of the accelerometry signal into logically coherent and numerically contiguous intervals: yellow (1–190), light blue (191–350), medium blue (351–800), dark blue (801–2500), and green (2501–30000). Extremes values in the low range (brown, 0) and high range (purple, >30000) are not considered.

