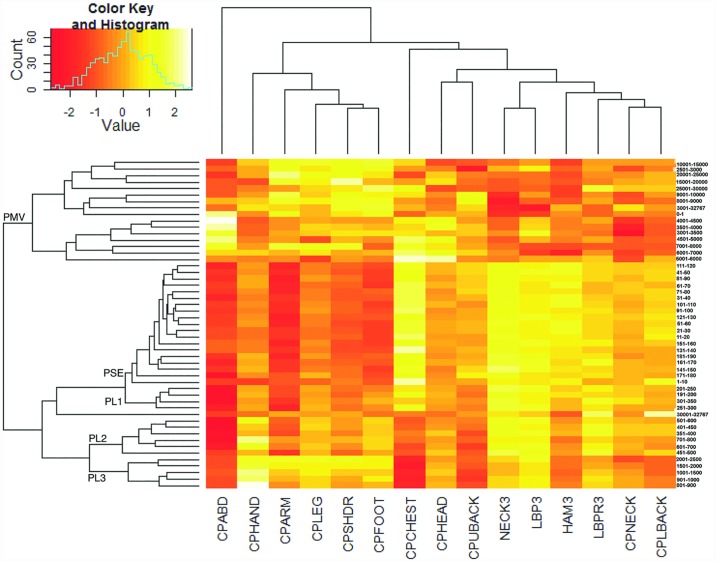
Fig 3. Two-way hierarchical clustering reveals new intervals.
The logically coherent and numerically contiguous intervals described in Fig 2 are adopted here in a two-way hierarchical clustering structured to define intensity intervals that are tuned to the presence of regional pain. The figure demonstrates the relationship between the clustering of axial pain and appendageal pain (bottom row) and the segregation of the accelerometry intervals (right hand column). The ordering of the columns and rows is not selected based on activity intensity, rather it is selected to optimize relationships and segregations between the many cells as visualized by the resulting heatmap. This reveals 5 distinct clusters of continuous activity intensity (excluding the extreme values of 0 and >30000) that define our new intervals (left hand column): Performance Sedentary (PSE) = 1–100, Performance Light 1 (PL1) = 101–350, Performance Light 2 (PL2) = 351–800, Performance Light 3 (PL3) = 801–2500, and Performance Moderate and Vigorous (PMV) = 2501–30000.

