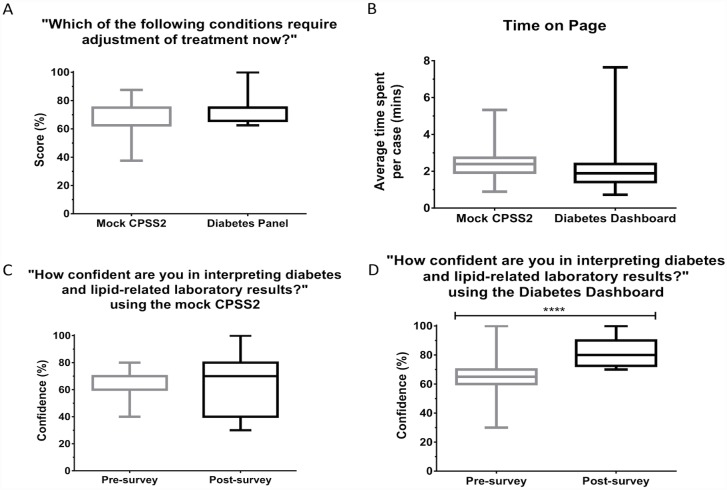
Fig 6. Box plots showing the participants’ (A) ability to determine if the adjustment of treatment was required, (B) average time (in minutes) spent on each case, (C) perceived confidence before and after completing the survey using the mock CPSS2 interface, (D) perceived confidence before and after completing the survey using the mock CPSS2 interface, using either interface.
The exact question asked in the survey is shown in the title of the graphs. ** denotes p<0.05, **** denotes p<0.0001.

