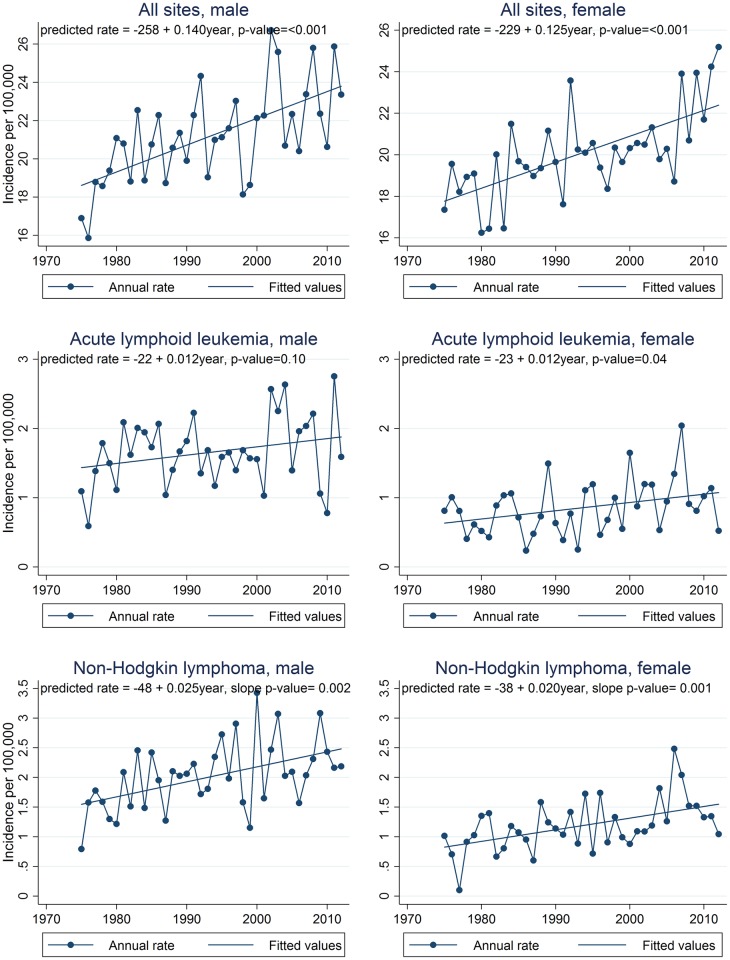
Fig 3. Annual incidence trends for all sites combined, acute lymphoid leukemia, and Non-Hodgkin lymphoma, 1975–2012, SEER 9 registries.
Annual rates are shown by connected points and the least squares regression line is shown as a straight line. Regression equations and p-values for trend are also shown. SEER 9 registries include Atlanta, Connecticut, Detroit, Hawaii, Iowa, New Mexico, San Francisco-Oakland, Seattle-Puget Sound, and Utah.

