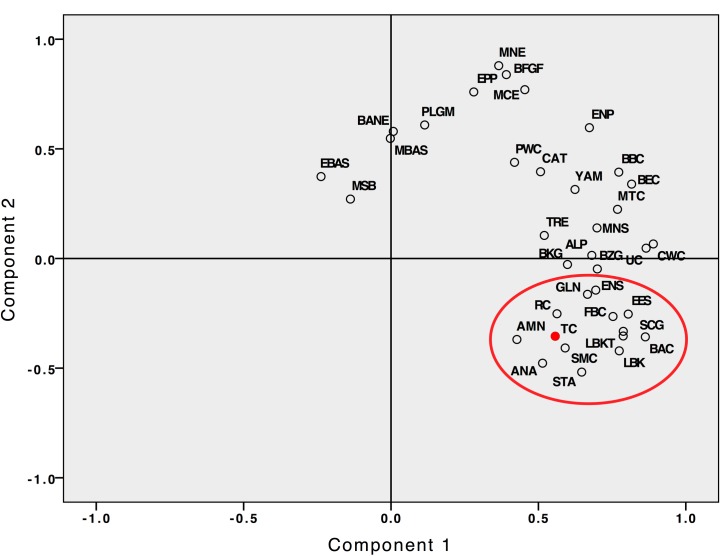
Fig 1. PCA plot of mitochondrial DNA frequencies of 37 Eurasian populations from the Upper Paleolithic to the Early Bronze Age, including Trypillian population from Verteba (TC, shaded).
The Neo-Eneolithic cluster of farming populations from Asia Minor and Europe is circled on the graph. Culture abbreviations, population sizes and the sources of data are given in the S2 Table.

