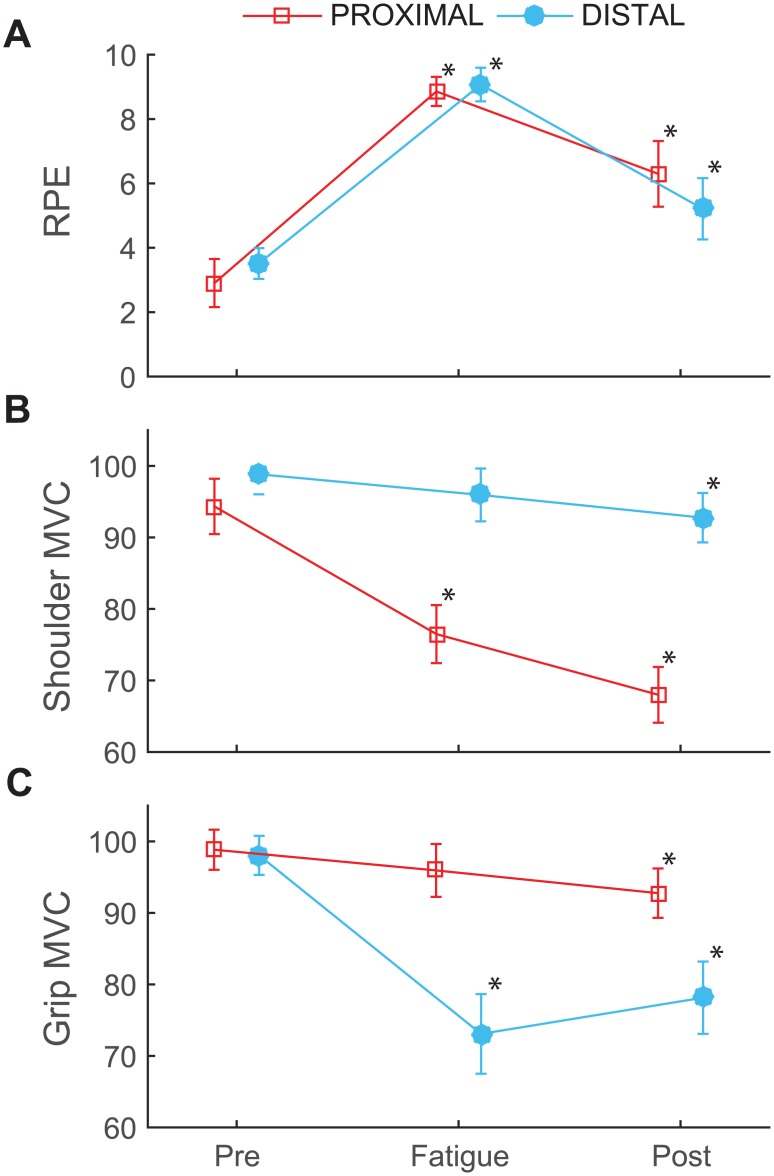
Fig 2. Perceived exertion and strength.
(A) Average ratings of perceived exertion (RPE), (B) shoulder flexion maximum voluntary contraction (MVC), and (C) grip MVC for the proximal (squares) and distal (circles) fatigue sessions after the pre-test, fatigue, and post-test on each day. MVCs are reported as a percentage of the initial MVC. Error bars represent 95% confidence intervals. * indicates a difference from baseline strength.

