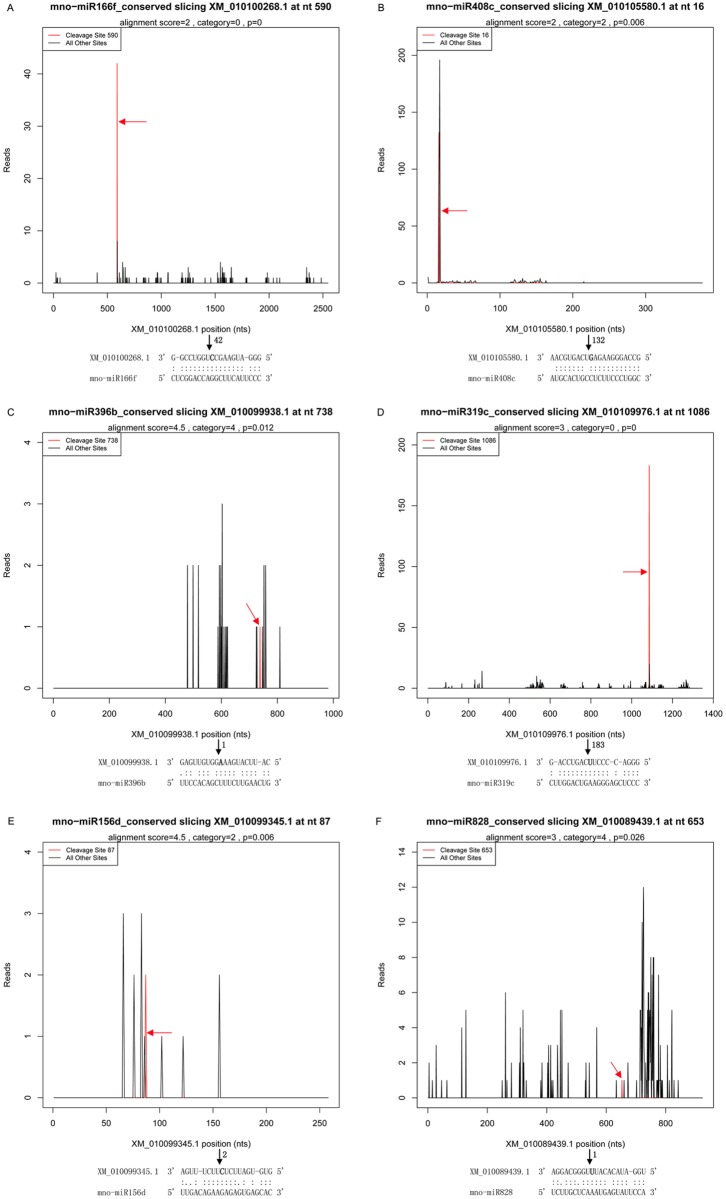
Fig 3. T-plots of the targets cleaved by miRNA in CL and DL.
The T-plots show the distribution of 3’ end of the degradome tags within the full-lengthof the target mRNA sequence (bottom). The red line represents the cleaved target tags and is shown in red arrow. The alignment along with the detected cleavage frequencies (absolute numbers) are shown beside the black arrow and it shows the miRNA with a portion of its target sequence (top). The two dots indicate matched RNA base pairs; one dot shows a GU mismatch whereas none dot represent other types of mismatch. The bold letter (nucleotide) on the target transcript indicates the cleavage site showed by the blank arrow. (A) XM_010100268.1, a category 0 target for mno-miR166f in CL. (B) XM_010105580.1, a category 2 target for mno-miR408c in CL. (C) XM_010099938.1, a category 4 target for mno-miR396b in CL. (D) XM_010109976.1, a category 0 target for mno-miR319c in DL. (E) XM_010099345.1, a category 2 target for mno-miR156d in DL. (F) XM_010089439.1, a category 4 target for mno-miR828 in DL.

