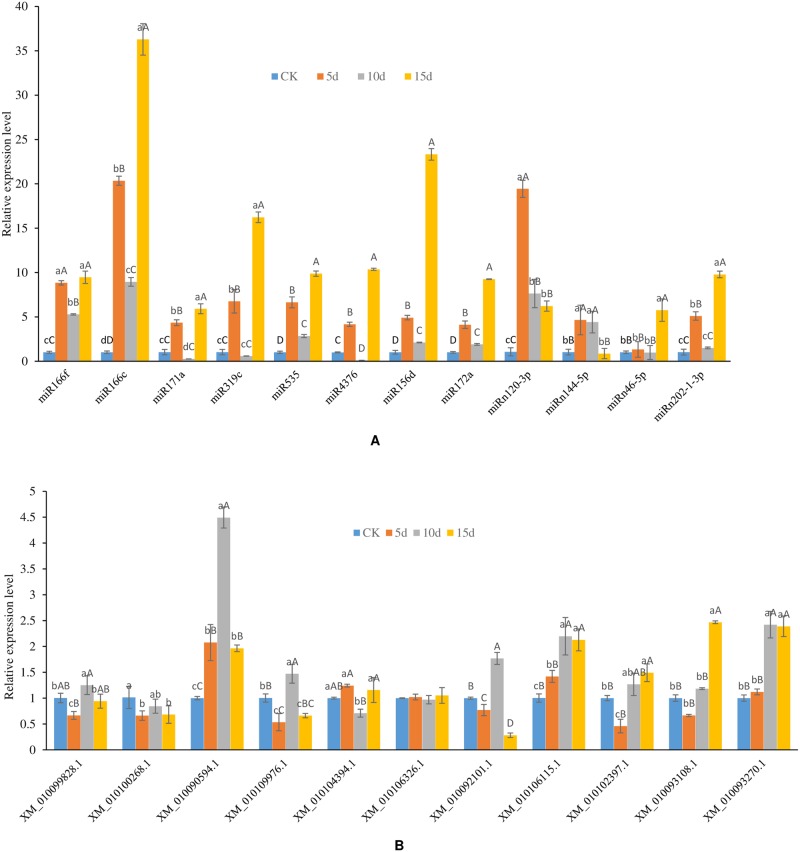
Fig 8. Expression analysis of 13 miRNA-mRNA pairs under drought stress with different processing time.
The expression levels of miRNAs and their mRNA targets were normalized to the level of β-actin. The x axis represents different miRNA (A) or mRNA targets (B), and the y axis represents the relative expression level of miRNAs (A) or mRNA targets (B). The results are mean ± SD of the triplicates of three biological replicates. Letter superscripts above bar indicate the significant difference of the changes between different drought stress time with the level of P > 0.05 (shown as the same or no letter superscripts), 0.01 < P ≤ 0.05 (shown as different small letter superscripts) and P ≤ 0.01 (shown as different capital letter superscripts). (A) Expression profile of miRNAs. (B) Expression profile of mRNA targets.

