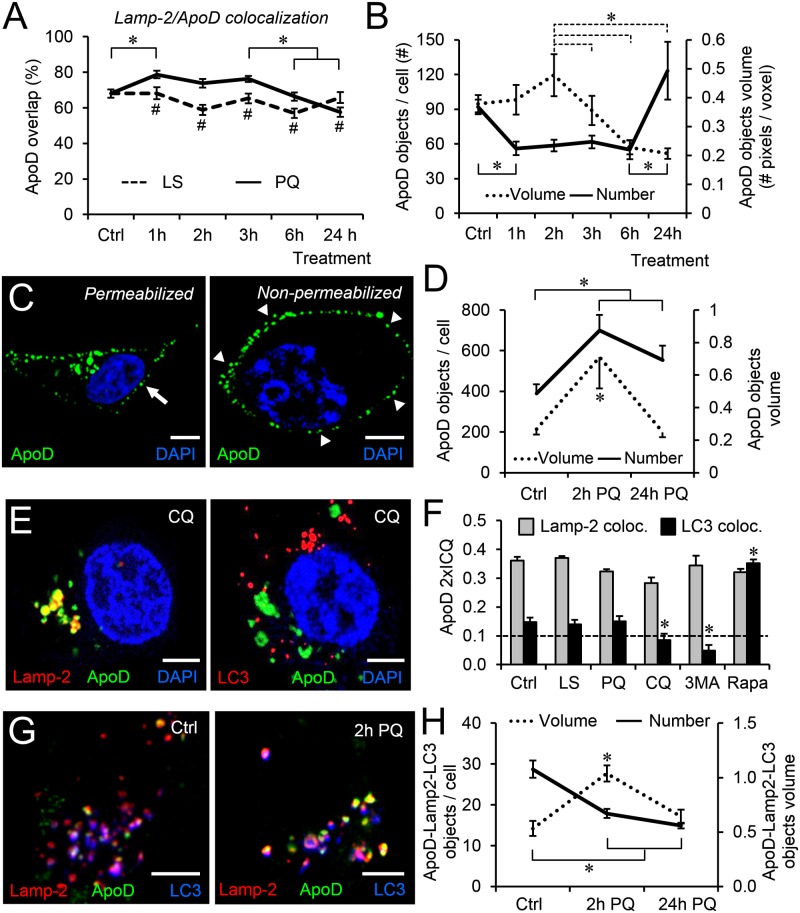
Fig 3. Lysosomal location of ApoD is followed by either entrance in autophagolysosomes or plasma membrane targeting.
A. Spatial colocalization of ApoD with Lamp-2 (Overlap referenced to ApoD signal) in 1321N1 cells in control and PQ treatment over time. B. Number and volume of ApoD-positive objects along PQ treatment. C. Representative confocal sections of ApoD signal in permeabilized and non-permeabilized 1321N1 cells at 24h of PQ treatment. D. The number and volume of ApoD-positive membrane objects significantly differ with time of PQ treatment (Number: p = 0.002; Volume: p = 0.004). E. Representative confocal sections of 1321N1 cells labeled with ApoD and either Lamp-2 or LC3 after 1h of chloroquine (CQ) treatment, demonstrating that ApoD entrance in autophagolysosomes is dependent on lysosome-phagosome fusion. F. Colocalization index referenced to ApoD signal for LELC and autophagolysosomes in control and experimental conditions: 2h low serum (LS); 2h PQ; 1h CQ; 1h 3-methyladenine (3-MA) and 1h Rapamycin (Rapa). G. Representative confocal sections showing triple colocalization of ApoD, Lamp-2 and LC3 in control and 2h PQ treatment. H. Number and volume of ApoD/Lamp-2/LC3-positive objects in control and after 2 or 24h PQ treatment. Error bars in all graphs represent SEM (n = 20 cells/marker from at least two independent experiments). Object volume was measured by number of pixels/voxel in B, D and H. Statistical differences were assessed by ANOVA on Ranks (p<0.001) with Tukey post-hoc method (p<0.05, denoted by asterisks within variables, and by number sing between variables). Calibration bars in C,E,G: 5 μm.

