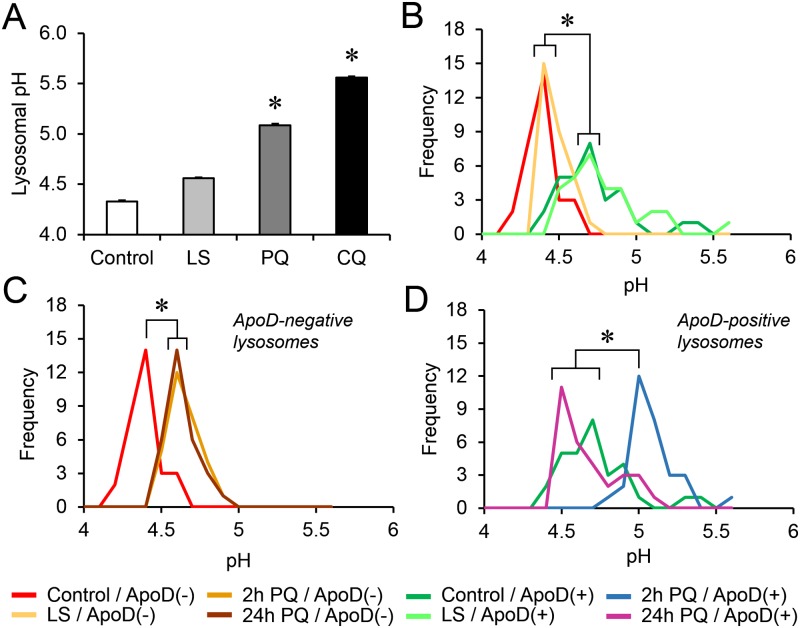
Fig 6. Single-lysosome pH measurements and ApoD labeling identify lysosomal populations with differential responses to oxidative stress.
A. LysoSensor ratiometric excitation analysis of lysosomal pH in 1321N1 cell populations under LS (2h), PQ (2h), or CQ (1h) conditions (n = 30 cells/condition). Oxidative stress generated by PQ alkalinizes the lysosomal compartment. CQ was used as positive control for alkalinization. B-D. Frequency distribution of lysosomal pH measured by confocal emission spectra analysis in single lysosomes of 1321N1 cells. Immunolocalization of ApoD allows for the detection of ApoD-positive and negative lysosomes (n = 30 lysosomes/category). ApoD-positive and negative lysosomes in control and LS conditions are compared in B. ApoD-positive lysosomes distribution peak at pH 4.7 in both conditions, while that of ApoD-negative lysosomes is 4.4. The response of ApoD-negative lysosomes to PQ is shown in C. A small alkalinization (0.2 pH units) is established by 2h and maintained after 24h of PQ treatment. The response of ApoD-positive lysosomes to PQ is shown in D. ApoD is present in a subset of lysosomes specifically sensitive to oxidative stress that undergo a large (0.5 pH units) but reversible alkalinization in response to PQ. Differences were assessed by ANOVA on Ranks with Tukey post-hoc method (p<0.05, denoted by asterisks).

