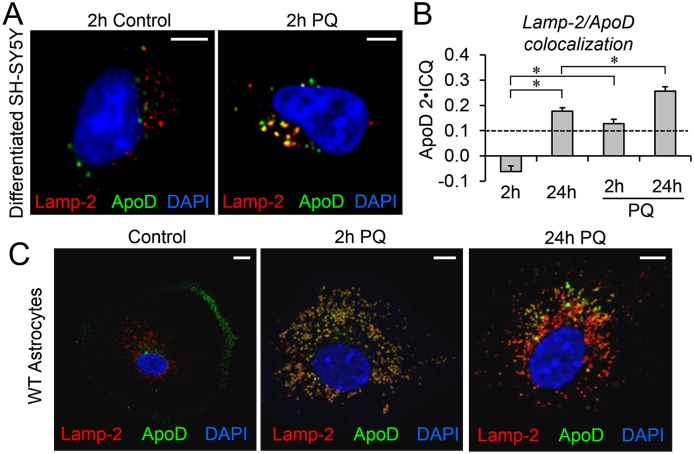
Fig 8. ApoD is targeted to lysosomes in an oxidative stress-dependent manner in differentiated neurons and primary astrocytes.
A. Representative fluorescence microscopy images of ApoD and Lamp-2 in differentiated SH-SY5Y neurons after 2h exposure to hApoD with or without simultaneous PQ treatment. B. Average colocalization index referenced to ApoD signal (ApoD 2xICQ) in neurons treated with hApoD in control and PQ conditions. Significant colocalization is observed in control conditions only 24h post-ApoD exposure. Rapid entry into lysosomes is observed upon PQ treatment at 2h. The dotted line represents the colocalization threshold. Statistical differences (asterisks) were assessed by two-way ANOVA, Holm-Sidak post-hoc method (p<0.01). C. Representative fluorescence microscopy images of ApoD and Lamp-2 in primary WT murine astrocytes in control and PQ conditions. ApoD distribution changes dramatically from membrane labeling (concentrated in lamellae) to intracellular organelles showing a time-dependent LELC colocalization. Calibration bars in A,C: 5 μm.

