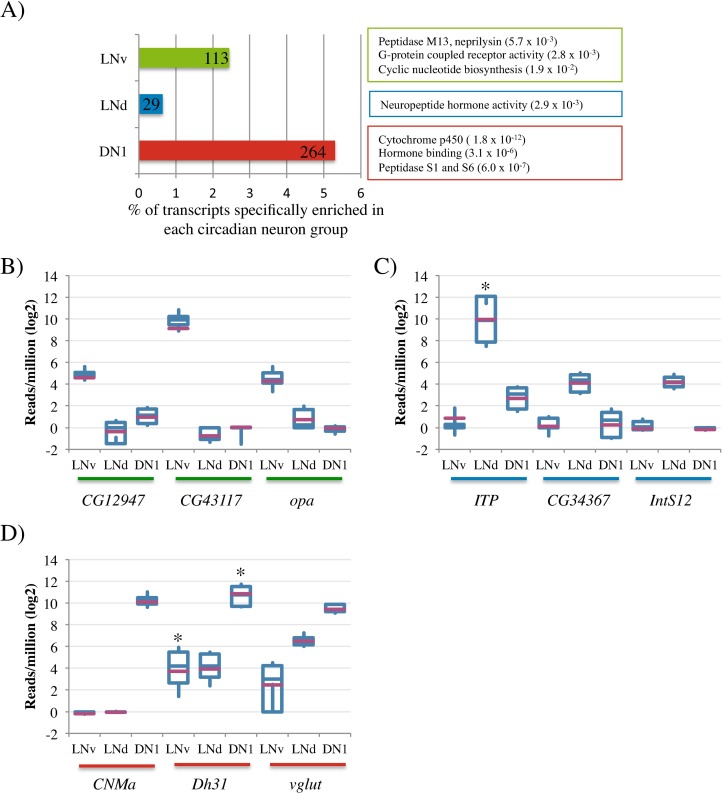
Fig 2. Transcripts enriched specifically in one group of circadian neurons.
A) The percentage of transcripts specifically enriched in each of the circadian neuronal groups is represented in a bar graph. LNvs are shown in green. LNds are shown in blue. DN1s are shown in red. The absolute number of enriched genes is indicated in each bar. Results of gene ontology analysis (GO) are included. B, C, and D) Boxplots showing the expression levels of some of the most significantly enriched transcripts in the LNvs (B), LNds (C) and DN1s (D). The purple bar indicates the mean. The asterix denotes those transcripts that show high variability due to cycling transcripts levels.

