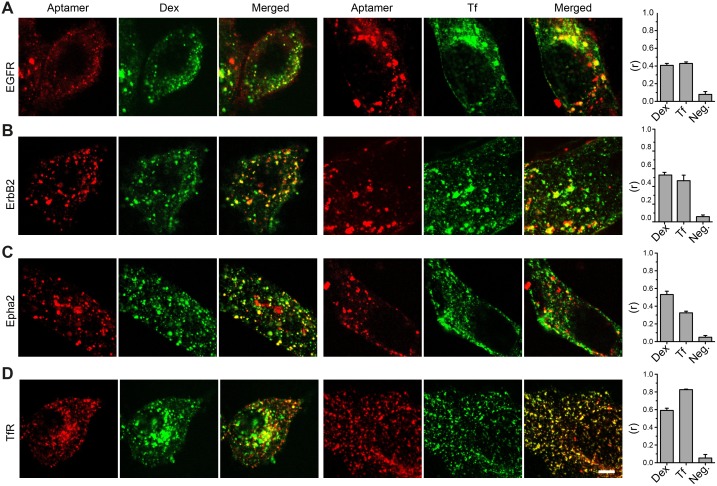
Fig 2. Co-localization of aptamers and classical endocytotic markers.
(A-C) Confocal images of cells co-stained with aptamers and Alexa488-dextran (Dex) or Alexa488-Transferrin (Tf). (D) Confocal images of a validated aptamer against the transferrin receptor (TfR) [7] on HEK293 cells was used as positive co-localization control with Tf. Pearson’s correlations coefficient (r) were calculated from 3 independent experiments (10 to 20 cells analyzed per experiments). The negative control (Neg.) was obtained by flipping one of the images horizontally before computing the correlation coefficient. Bars represent the average of three independent experiments and error is the SEM. Scale bar represents 5 μm.

