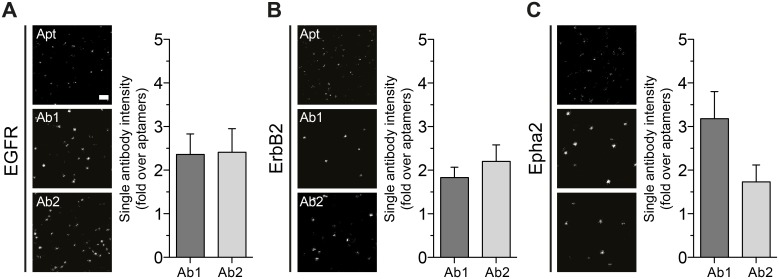
Fig 4. Average intensity of single antibodies and aptamers.
(A-C) Examples of comparable STED images with single aptamers or single antibody packages (primary-secondary) seeded on glass coverslips. Scale bar (top image on panel A) represents 500 nm. The plots associated display the average intensity from more than thousand spots of single antibody packages expressed as fold of single aptamer intensity. Error bars are the SEM of 3 independent experiments.

