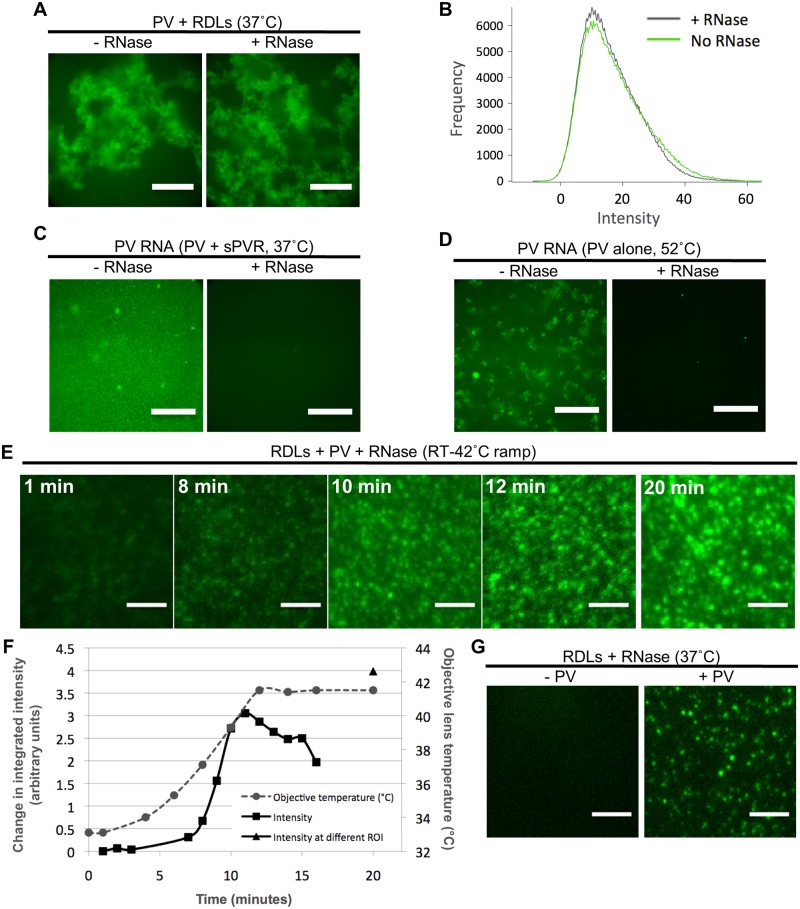
Fig 2. Receptor-decorated liposomes containing fluorescent dye detect PV RNA release.
A) Representative images of YoPro-1 encapsulating receptor-decorated liposomes (YRDLs) complexed with PV in the presence or absence of RNase A (50 μg/ml). Note that RNase A was added to the extra-liposomal space after PV-YRDL complexes were formed, but prior to heating the samples for 20 min at 37°C. Images were collected at room temperature using a 20X objective as described in Materials and Methods. Scale bars are 200 μm. B) Normalized histograms showing the number of pixels (y-axis) with a given level of fluorescence (in arbitrary units) (x-axis) of PV-YRDL complexes shown in A in the absence (green curve) and presence (black curve) of RNase A. (C and D) Representative images of PV RNA (in the absence of liposomes) in the presence of YoPro-1 dye following induction of uncoating by sPVR at 37°C (C) or by heating at 52°C (D) for 20 min in the presence or absence of RNase A (50 μg/ml). Images were collected using a 100X objective as described in Materials and Methods. Scale bars are 40 μm. E) Representative still frames from a time lapse of PV-YRDLs gradually heated from room temperature to 42°C. Average time lapse for averaged image is indicated. After 15 min of imaging a single field of view, a second region of interest was imaged in order to evaluate the influence of photobleaching on the fluorescence intensity (second ROI at 20 min shown on the right-side panel). Images were captured at 100x magnification using a custom built Total Internal Reflectance Fluorescence Microscopy (TIR-FM) setup, attached to an Olympus IX-71 microscope, as described in Material and Methods. Scale bars are 5 μm. F) PV-YRDLs integrated fluorescence intensity obtained as indicated in Materials and Methods (expressed as fold change of T = 1 min, left y-axis) during a 20 min time course (time in min along the x-axis) when the sample was heated from room temperature to 42°C. The temperature of the lens (right y-axis) is shown as a function of time (grey dashed line). Because the objective lens and the sample are 1.18 mm apart (with oil connecting the lens to the sample slide), the temperature of the lens is used to estimate the temperature of the sample. 42°C is the upper limit of the imaging apparatus. The black triangle shows the integrated fluorescence intensity of a region of interest that was imaged at a single time point of 20 min in order to assess photobleaching. G) Representative images of YoPro-1 encapsulating RDL using the same microscope setup described for E. YRDLs were incubated at 37°C for 10 min, alone with no PV (left), or were pre-incubated with PV at room temperature for 10 min to allow complex formation, and then incubated 37°C for 10 min (right). Scale bars are 5 μm.

