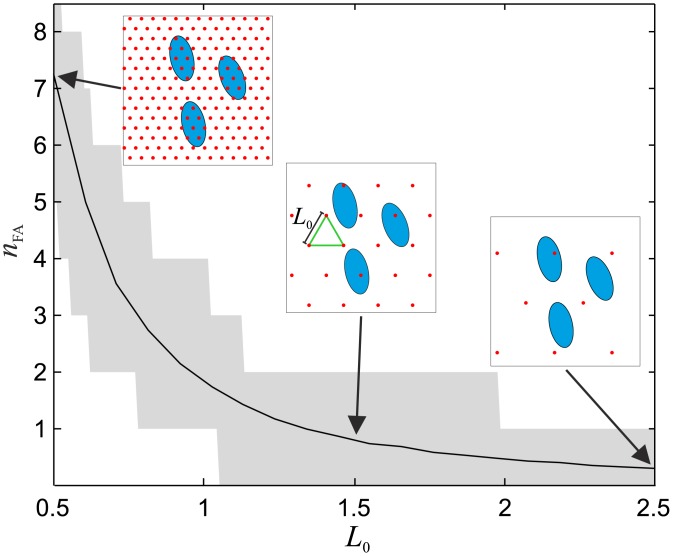
Fig 5. The relation between fluorescent markers distance (L0) and the quantity of fluorescent markers that are positioned within a focal adhesion (nFA).
Reported results have been evaluated numerically for 25000 elliptical focal adhesions (2μm x 1μm). The black solid line marks the average, the area shaded in grey the maximum and minimum.

