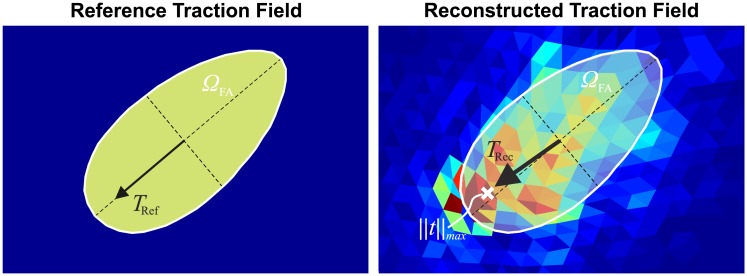
Fig 7. Example of the reference and reconstructed traction fields in the region of a single focal adhesion.
The white contour marks the border of the FA as defined in the in-silico model. The total traction force of the FA is plotted in both cases with a black arrow, whereas the white cross-shaped marker indicates the location with the highest traction stress within the FA.

