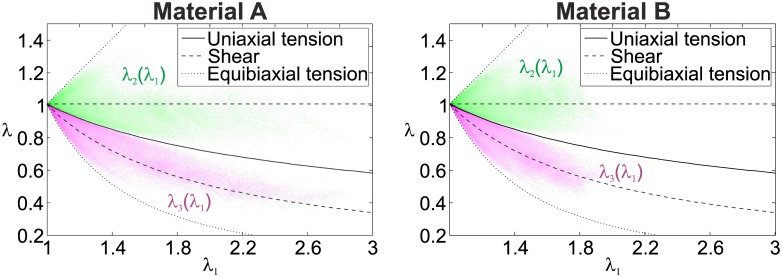
Fig 12. Principal Stretches λ2 (green cloud) and λ3 (violet cloud) vs. λ1 for the in-silico computation for material A and B.
The color intensity is proportional to the frequency. The solid, dashed and dotted lines indicate the relations of λ2(λ1) and λ3(λ1) for the cases of uniaxial tension, pure shear and equibiaxial deformation modes, respectively.

