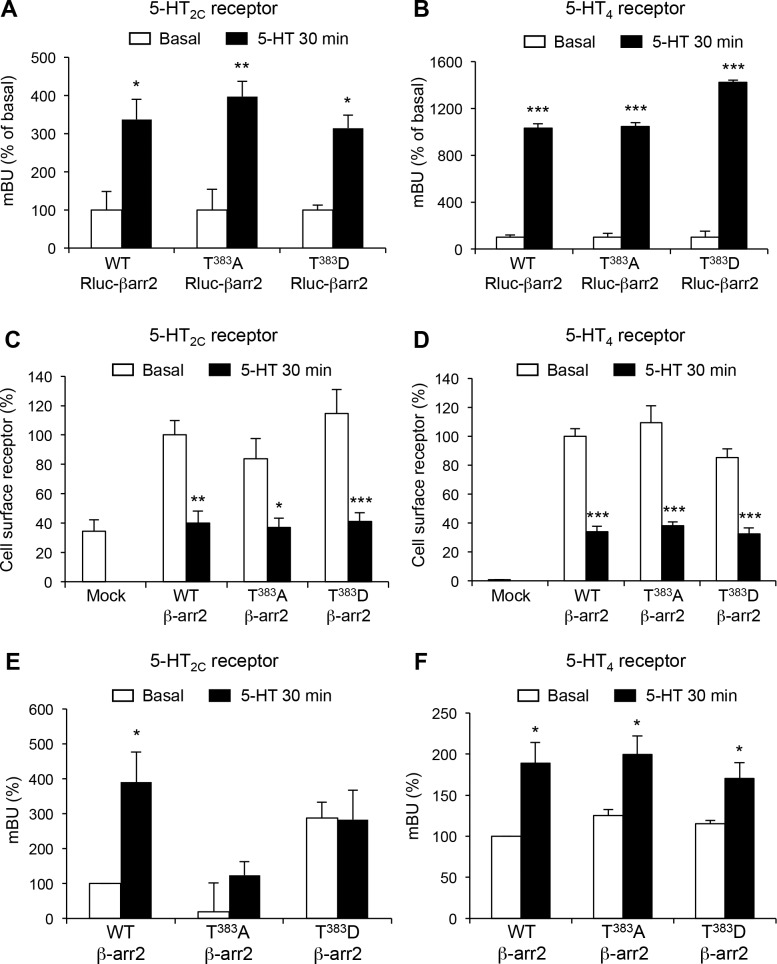
Figure 3. Thr383 phosphorylation underlies β-arrestin2 conformational rearrangement elicited by 5-HT2C receptor stimulation.
(A, B) Translocation of wild type (WT), T383A and T383D Rluc-β-arrestin2 to Myc-5-HT2C-YFP (A) or Myc-5-HT4-YFP (B) receptors in cells treated with either vehicle (Basal) or 1 or 10 µM 5-HT, respectively, was measured by BRET. Data represent the mean ± SEM of values obtained in three independent experiments and were normalized to the BRET signals measured in 5-HT-stimulated cells expressing WT Rluc β-arrestin2. (C, D) Cell surface expression of receptors was measured in the same experimental condition by ELISA using anti-Myc antibody. Data are the mean ± SEM of values obtained in three independent experiments. They were normalized to total receptor expression level and are expressed in % of basal receptor level at the cell surface in cells expressing WT β-arrestin2. (E, F) Conformational arrangement of WT, T383A and T383D double brilliance Rluc8-β-arrestin2-RGFP elicited by 5-HT2C and 5-HT4 receptor stimulation by 5-HT (1 and 10 µM, respectively). Equivalent expression of each BRET sensor was verified by ELISA. Data represent the mean ± SEM of values obtained in three independent experiments and were normalized to the basal intra-molecular BRET signal in cells expressing WT Rluc8-β-arrestin2-RGFP. One-way ANOVA: A, F(5,12)=10.75, p=0.0004; B, F(5,12)=320.9, p<0.001; C, F(6,14)=10.82, p<0.0001; D, F(6,14)=48.52, p<0.0001; E, F(5,12)=5.136, p=0.0095; F, F(5,12)=6.436, p=0.004. *p<0.05, **p<0.01 ***p<0.001 vs. corresponding basal.
DOI: http://dx.doi.org/10.7554/eLife.23777.017

