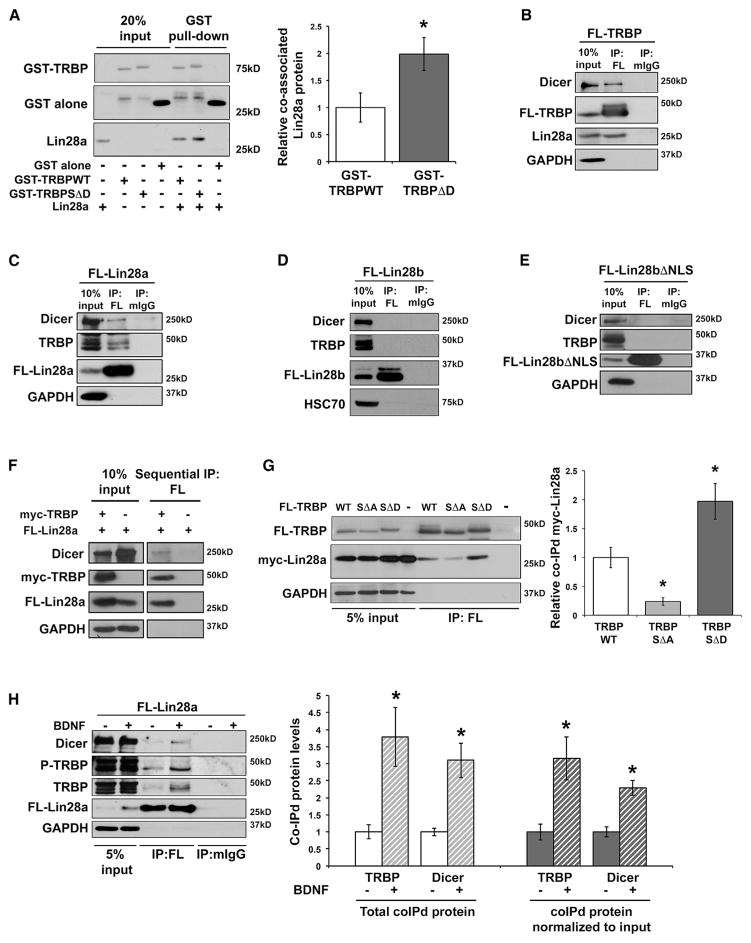
Figure 4. TRBP and Lin28a Co-association Is Enhanced by TRBP Phosphorylation.
(A) Representative immunoblot (left) and densitometric quantification (right) of purified Lin28a protein co-associated with purified GST-TRBP, normalized to TRBP pull-down and plotted relative to GST-TRBPWT (set as 1.0). A lower band in the GST-TRBP conditions that migrates similarly to GST alone reflects partial cleavage of the GST tag through a protease site between GST and TRBP. Uncropped blots are shown in Figure S4A.
(B–E) Lysates from HEK293T cells expressing (B) FL-TRBPWT, (C) FL-Lin28a, (D) FL-Lin28b, and (E) FL-Lin28bΔNLS were immunoprecipitated with anti-FLAG or control rabbit IgG (rIgG) or mouse IgG (mIgG) antibodies. Representative immunoblots (A–D) show immunoprecipitated proteins and co-immunoprecipitated endogenous proteins.
(F) Sequential IP of HEK293T cells lysates involving initial IP for myc-TRBP followed by subsequent IP for FL-Lin28a. A flowchart and experimental details are shown in Figure S4D.
(G) Representative immunoblot (left) and quantification (right) of lysates from HEK293T cells co-expressing FL-TRBPWT, SΔA, SΔD, or PCDNA3.1 alone (control) with myc-Lin28a and immunoprecipitated with anti-FLAG antibody. Myc-Lin28a was overexpressed to minimize differential the effects of the FL-TRBP constructs on total Lin28a levels. Co-immunoprecipitated myc-Lin28a was normalized first to myc-Lin28a input levels and then to immunoprecipitated FL-TRBP for each construct and plotted relative to the FL-TRBPWT condition (set as 1.0).
(H) Lysates from hippocampal neurons expressing FL-Lin28a and treated with either vehicle (growth medium) or BDNF (90 min) were immunoprecipitated with anti-FLAG or control mIgG antibody. Left: representative immunoblot. Right: co-immunoprecipitated TRBP and Dicer proteins quantified as both total co-immunoprecipitated protein (left) and input-normalized co-immunoprecipitated protein (right), plotted relative to vehicle alone, set as 1.0.
*p < 0.05 by t test for all experiments. Quantified data represent mean ± SEM. n = 3–5 independent replicates for each panel. See also Figure S4.

